
Using Multiple Kits
Kits are sometimes designed to be used by themselves, like HelloWorld, but most often multiple kits are meant to be used together. In this post, we will walk you through loading in a csv dataset, visualizing the dataset as a table, and getting the average of a column. The intent is to show how kits connect to one another and continue familiarizing you with Arctic Fox!
Previous Posts in Getting Started Series:
– Arctic Fox Install Guide
– Run Your First Kit
Download CSV Dataset
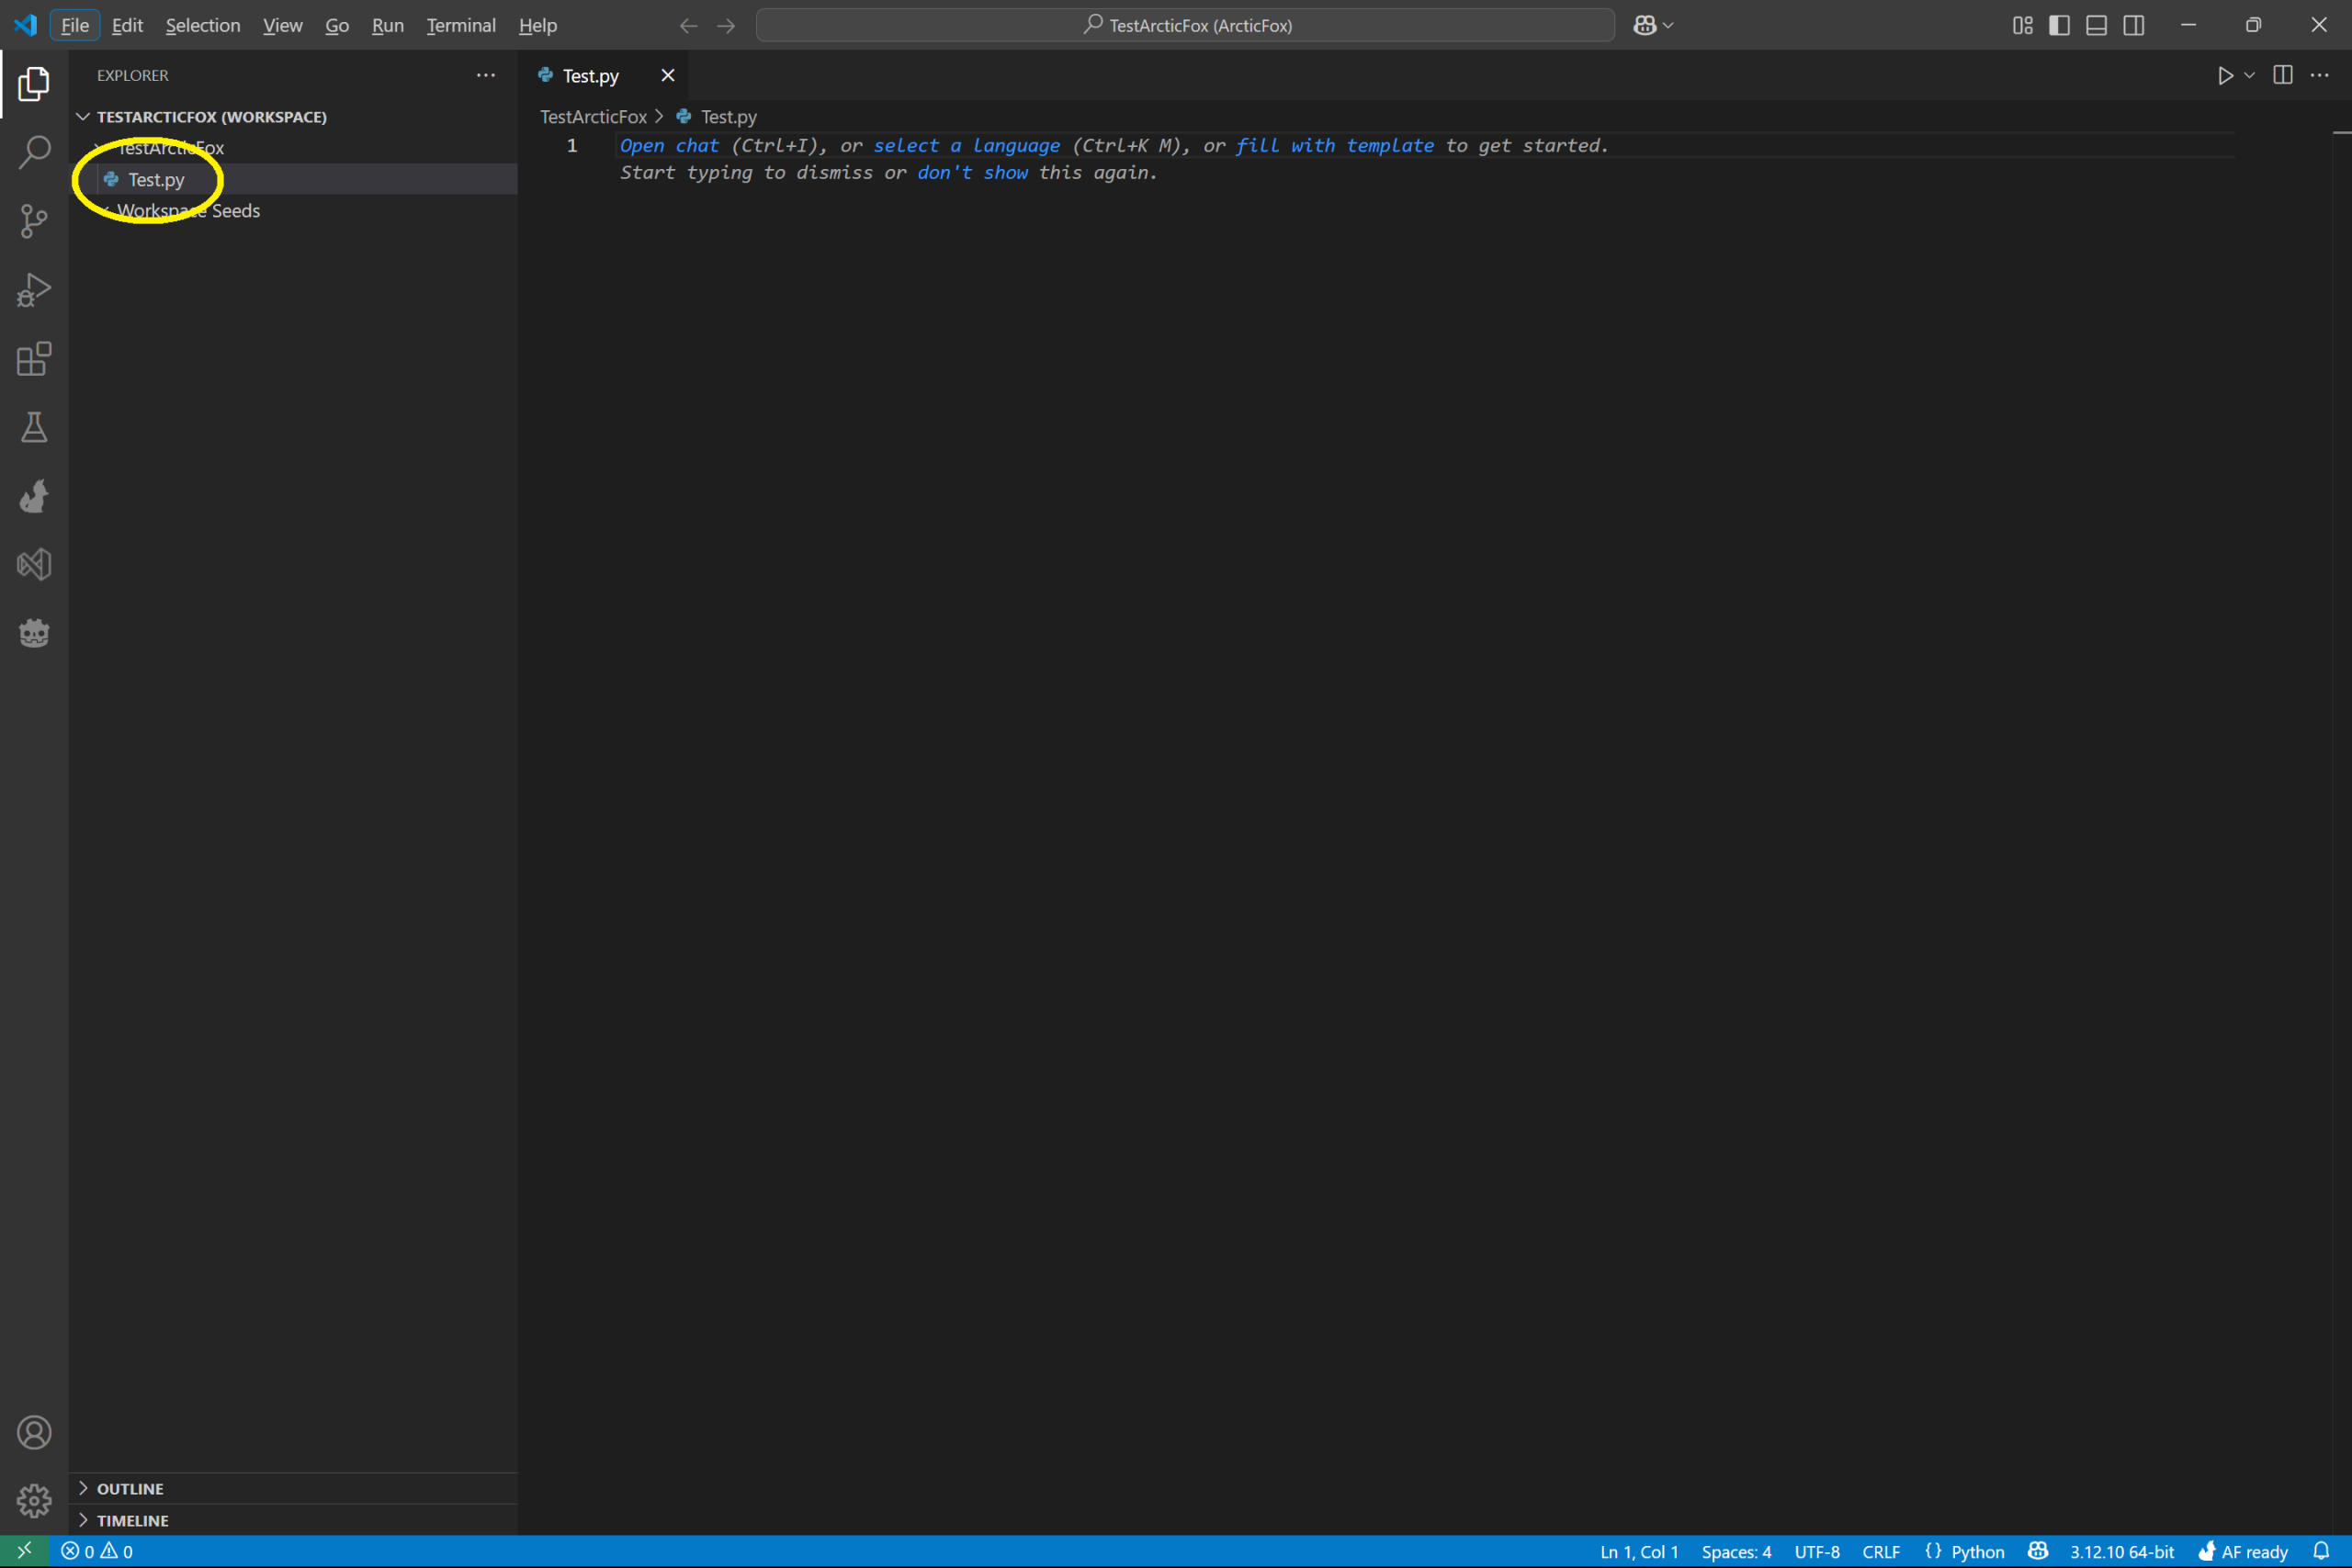
First, open the folder you used in the Run Your First Kit post in Visual Studio Code (VS Code). Open the Test.py file and delete the contents so that you have an empty file.
We will be working with tax data from the state of Idaho. Download the csv file here:
Download Idaho tax data csv
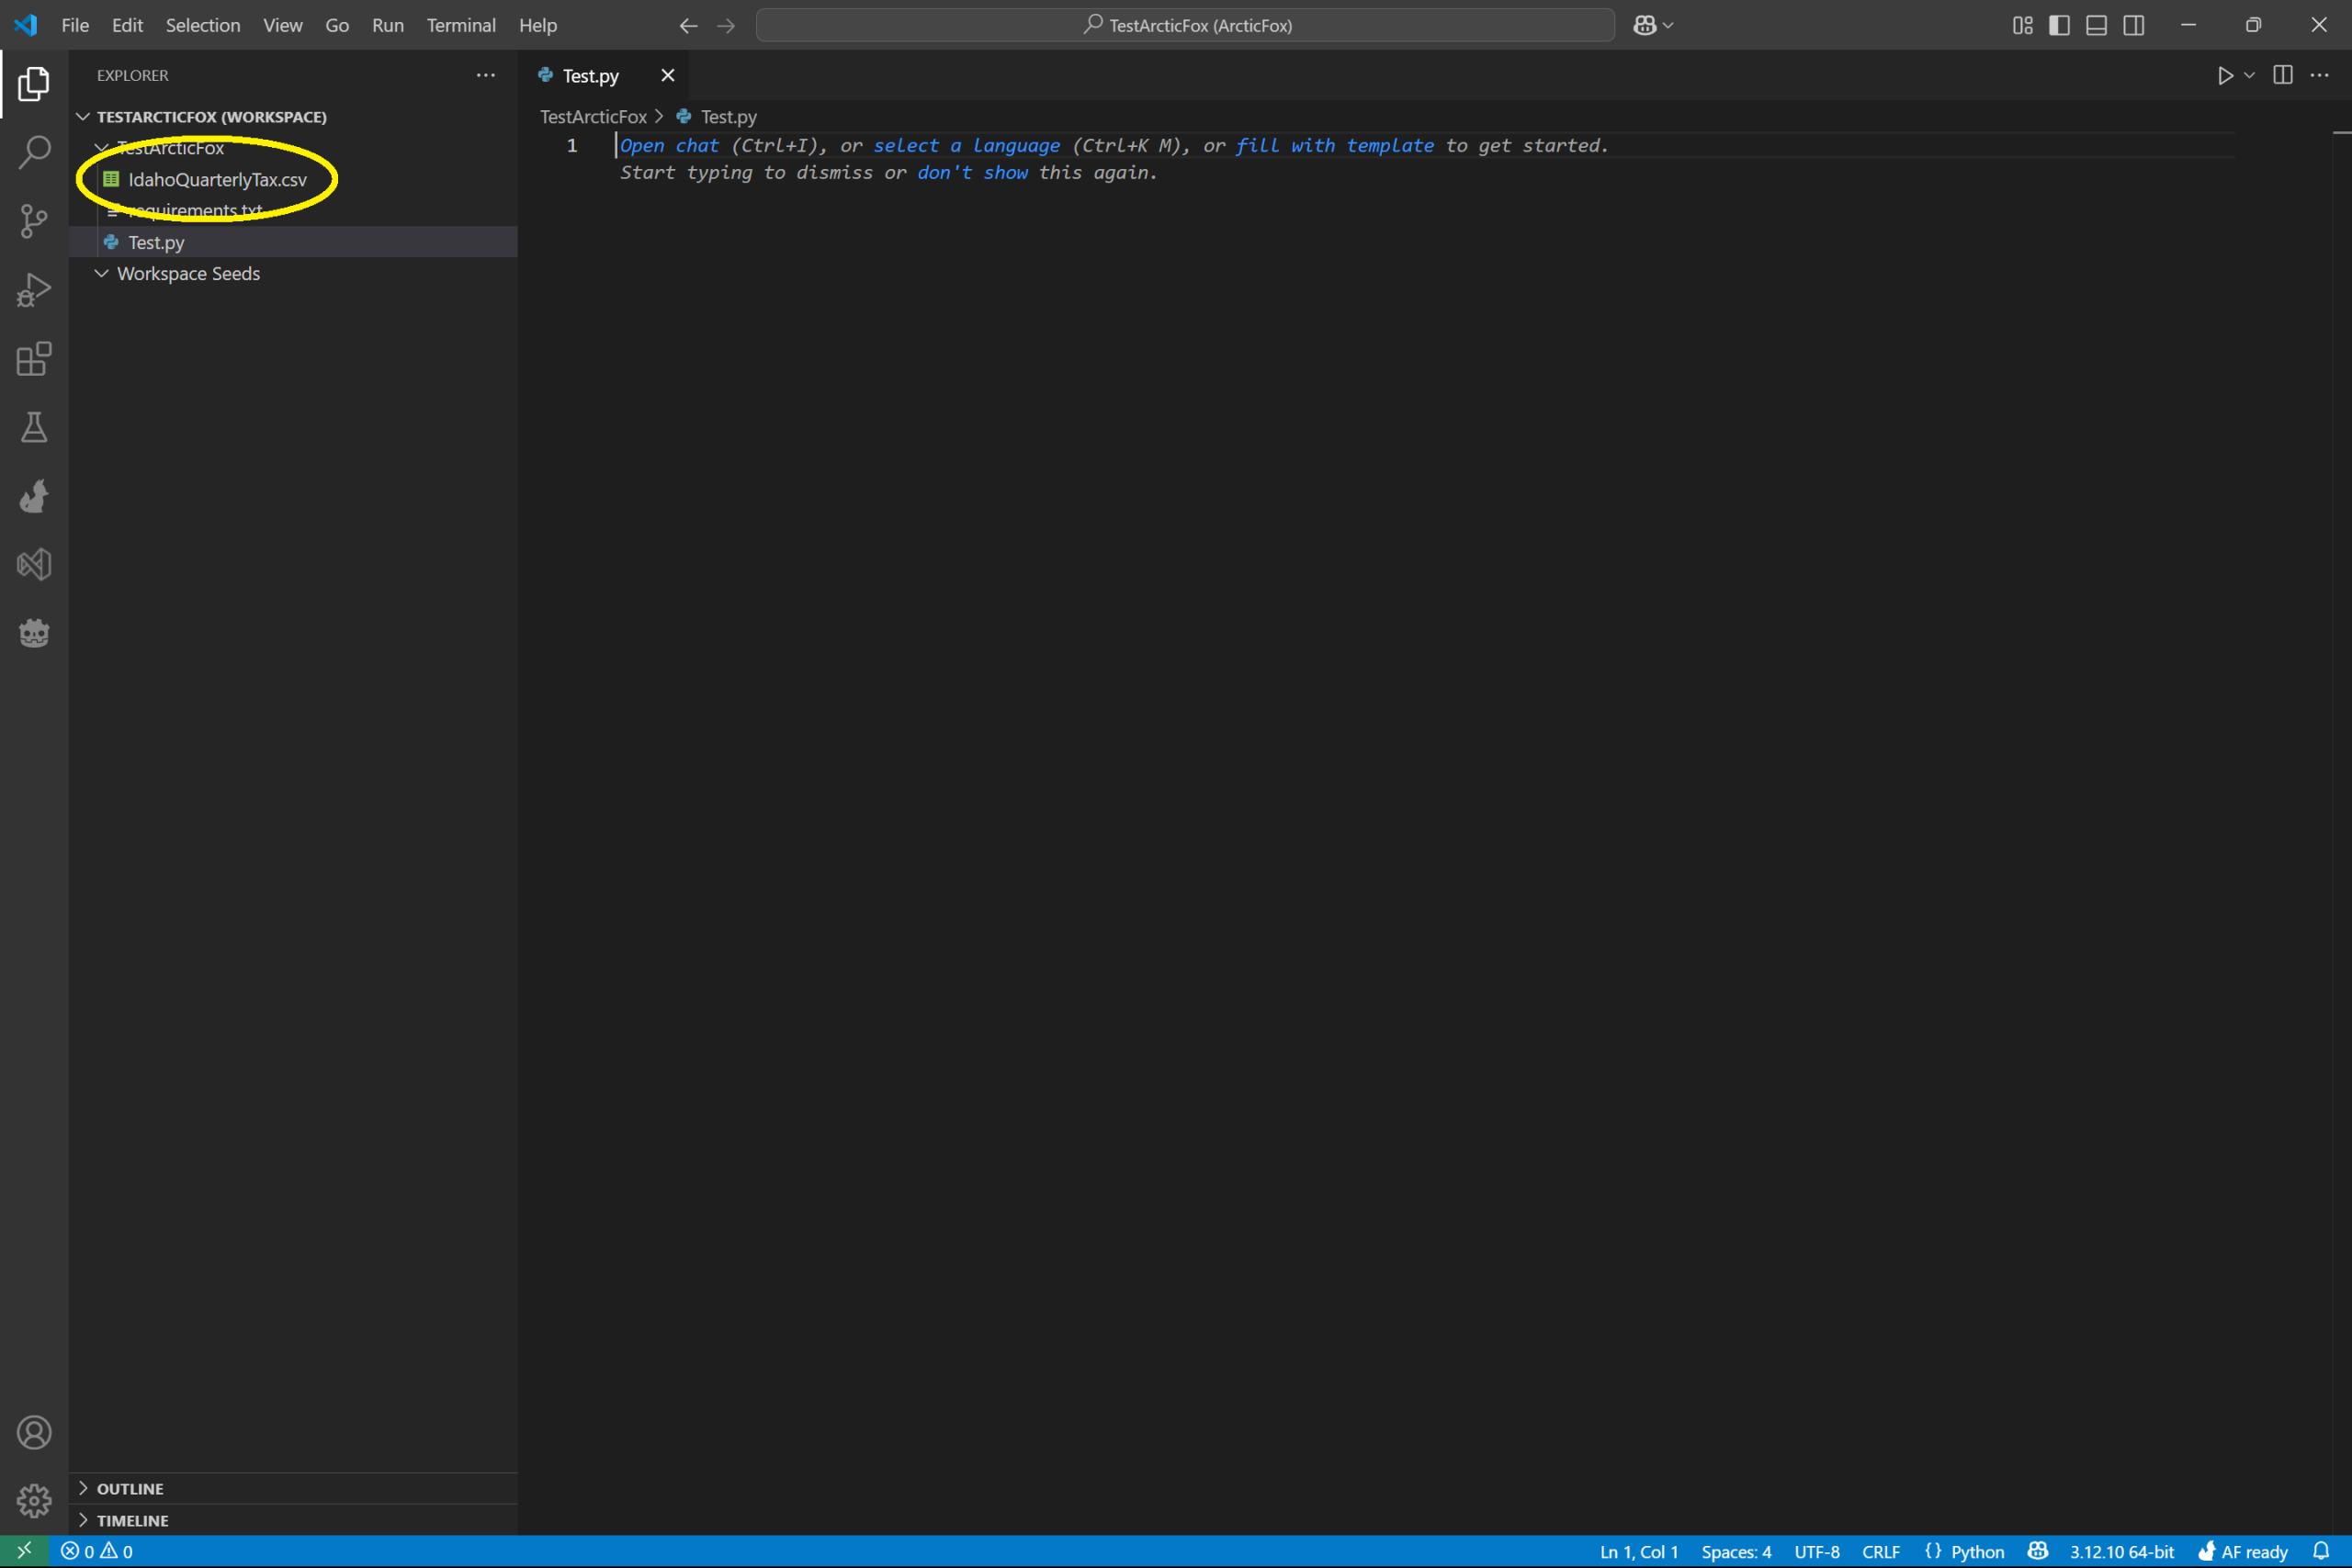
Add the downloaded csv file to the folder you have open in VS Code. You can do this either through the file browser or dragging the file into the explorer pane. Once added, you should it in the file list as shown below.
Load Dataset into Python
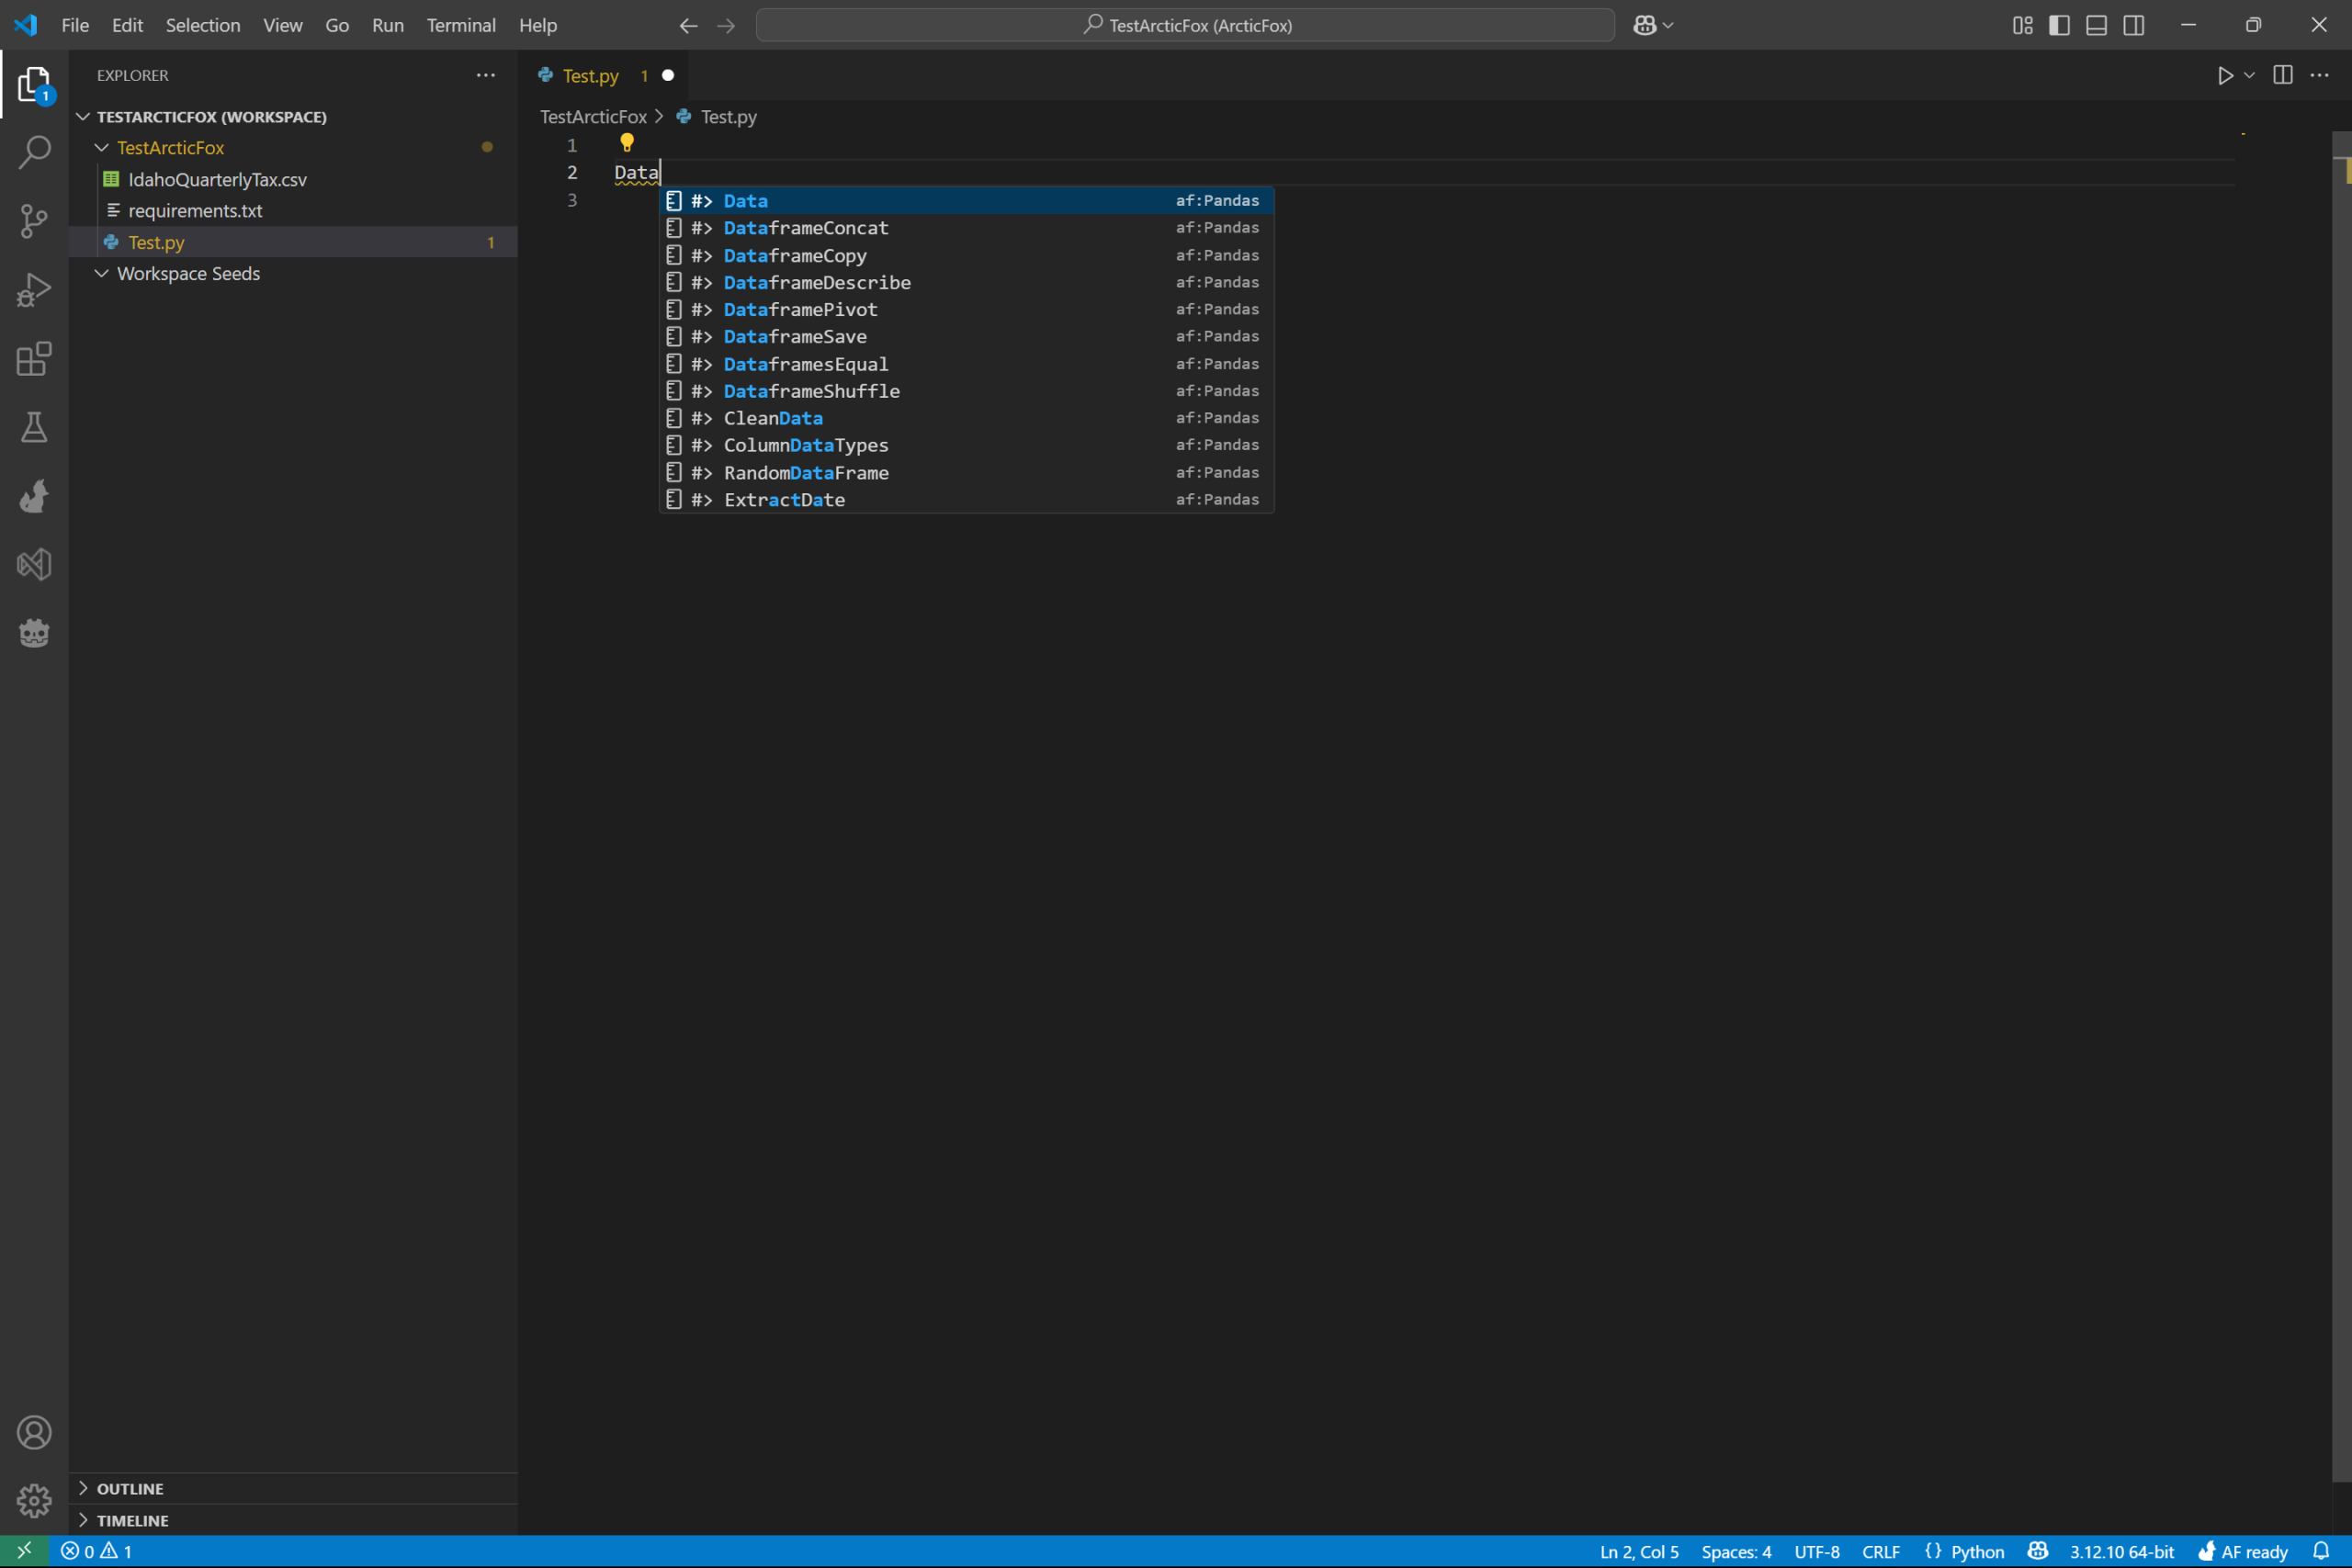
In your Python file, Test.py for us, type the word Data. This will make the autocomplete menu show a list of kits that are similar to the word Data.
Press the enter key with the #> Data kit highlighted.
After pressing enter, VS Code will modify the word Data will be replaced with #> Data.
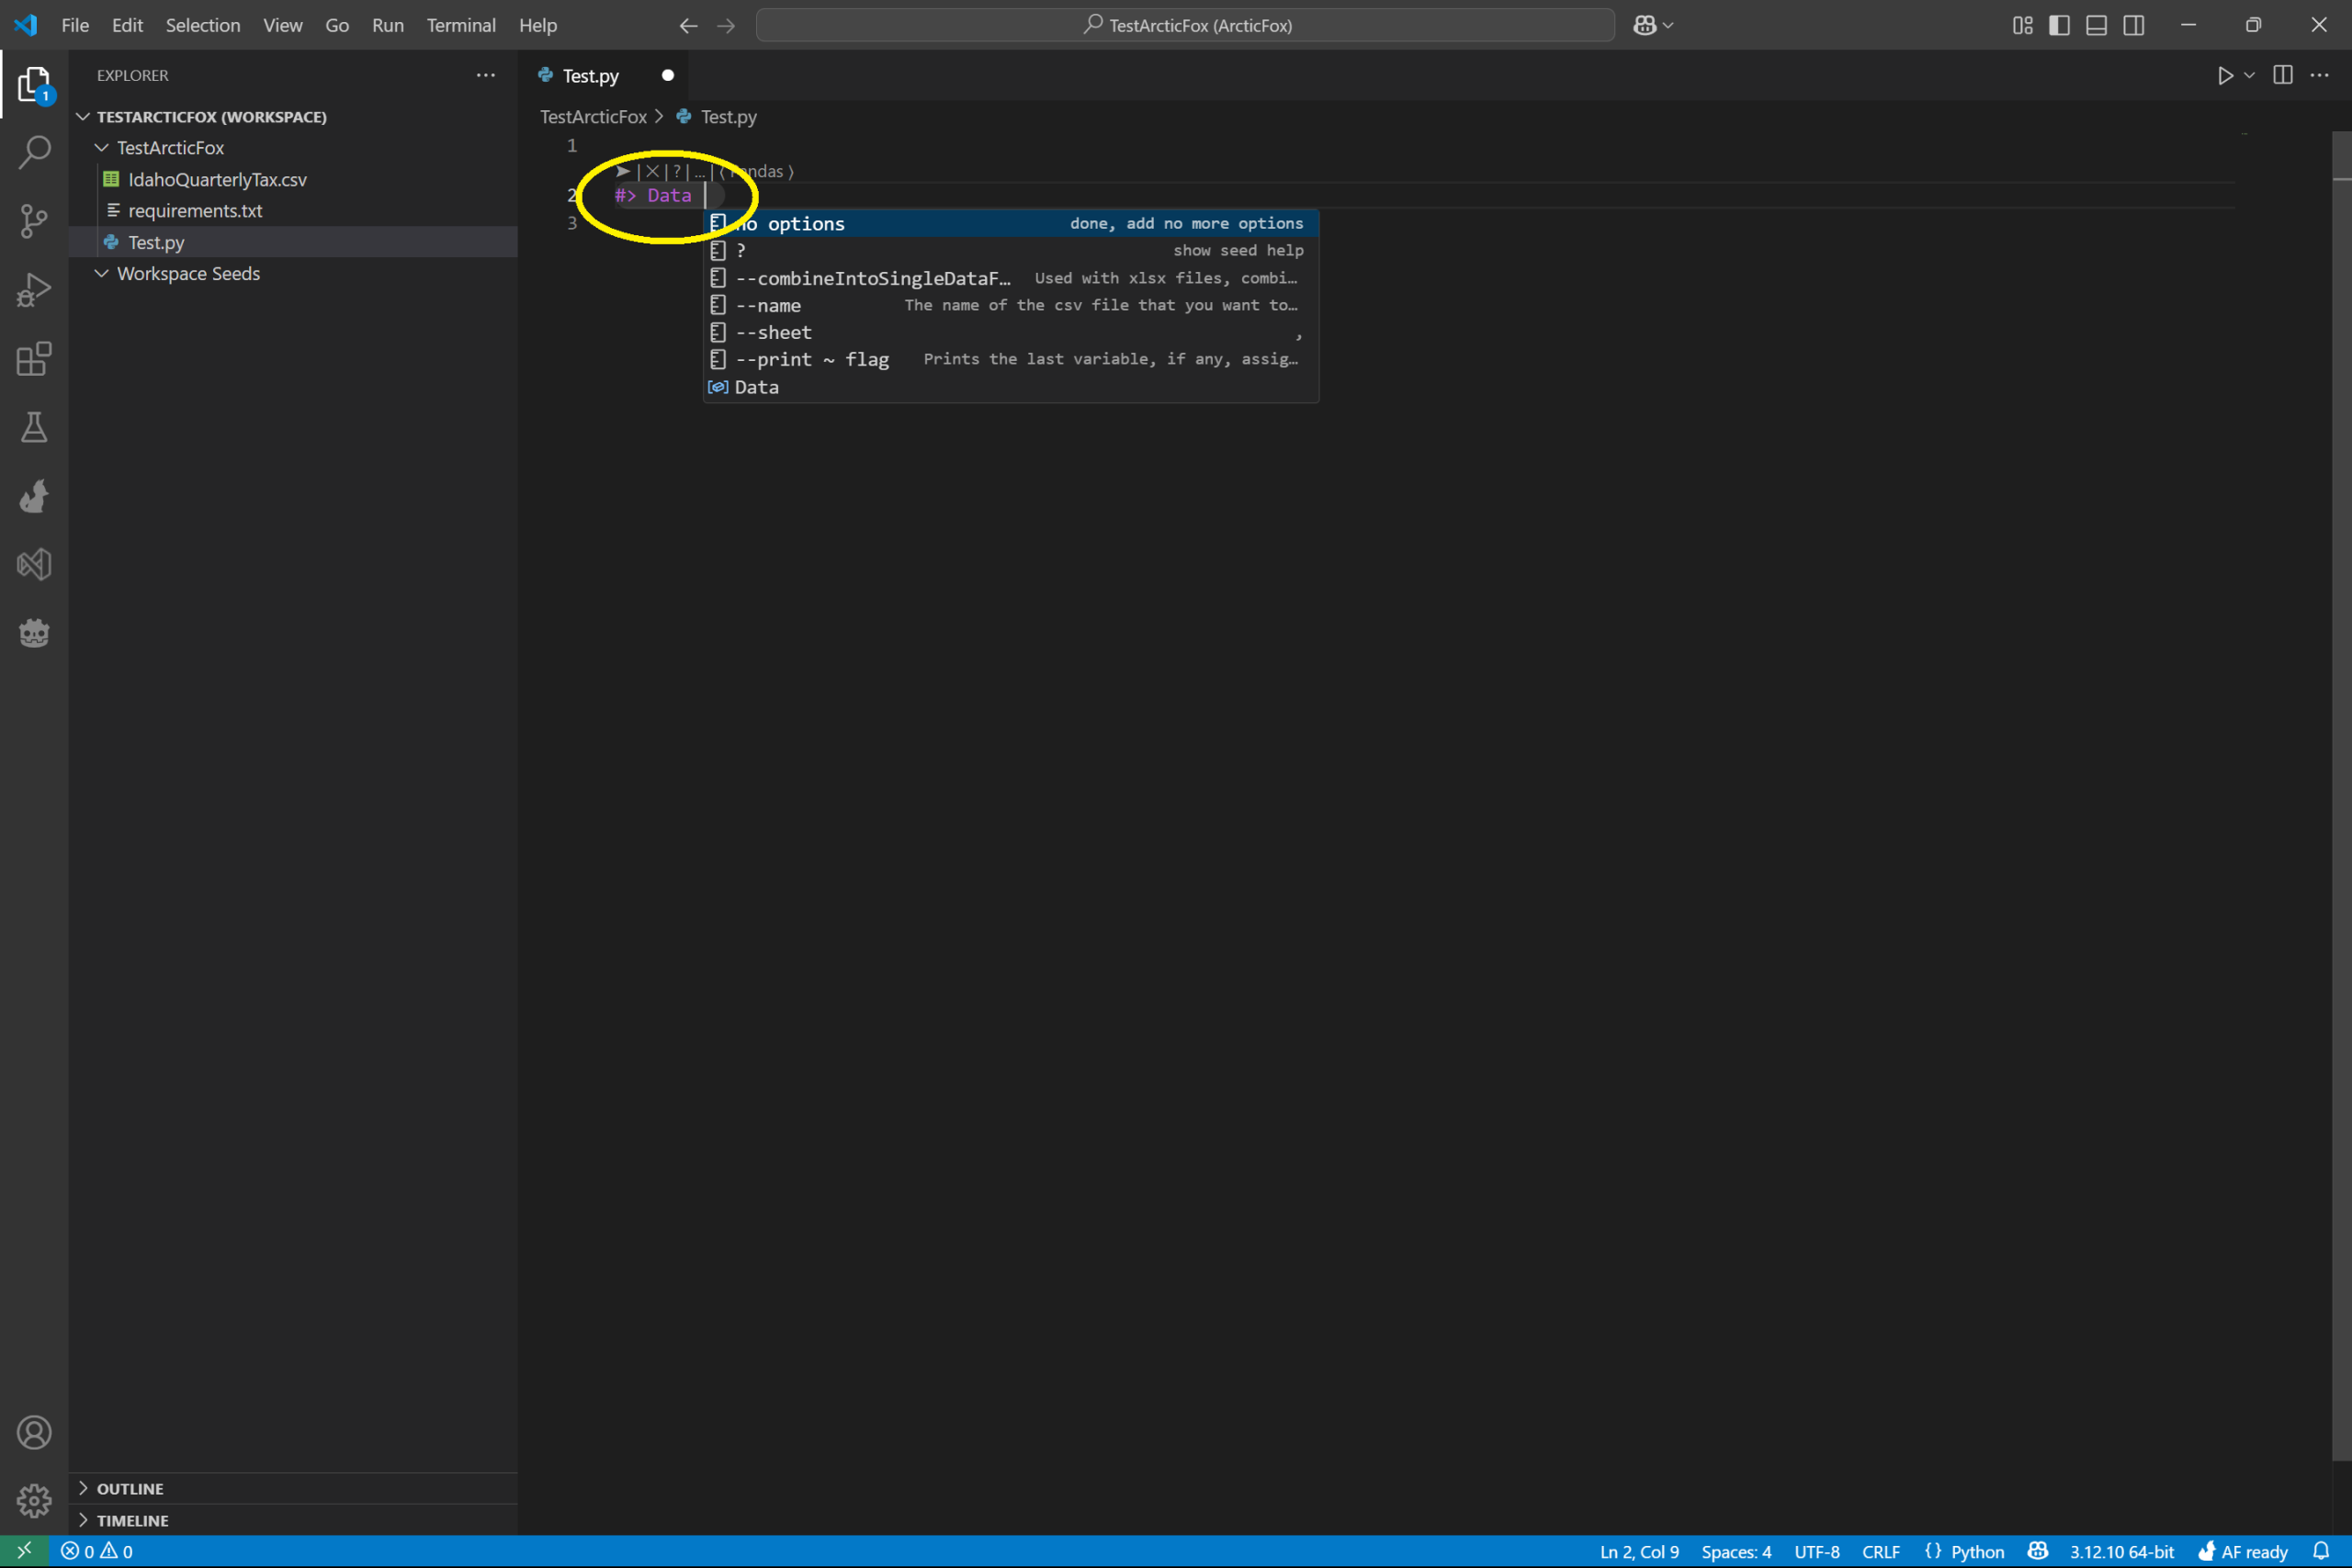
On the same line, after #> Data, type the name of the downloaded csv file. We named ours IdahoQuarterlyTax.csv. Hence, below, our full line is:
#> Data IdahoQuarterlyTax.csv
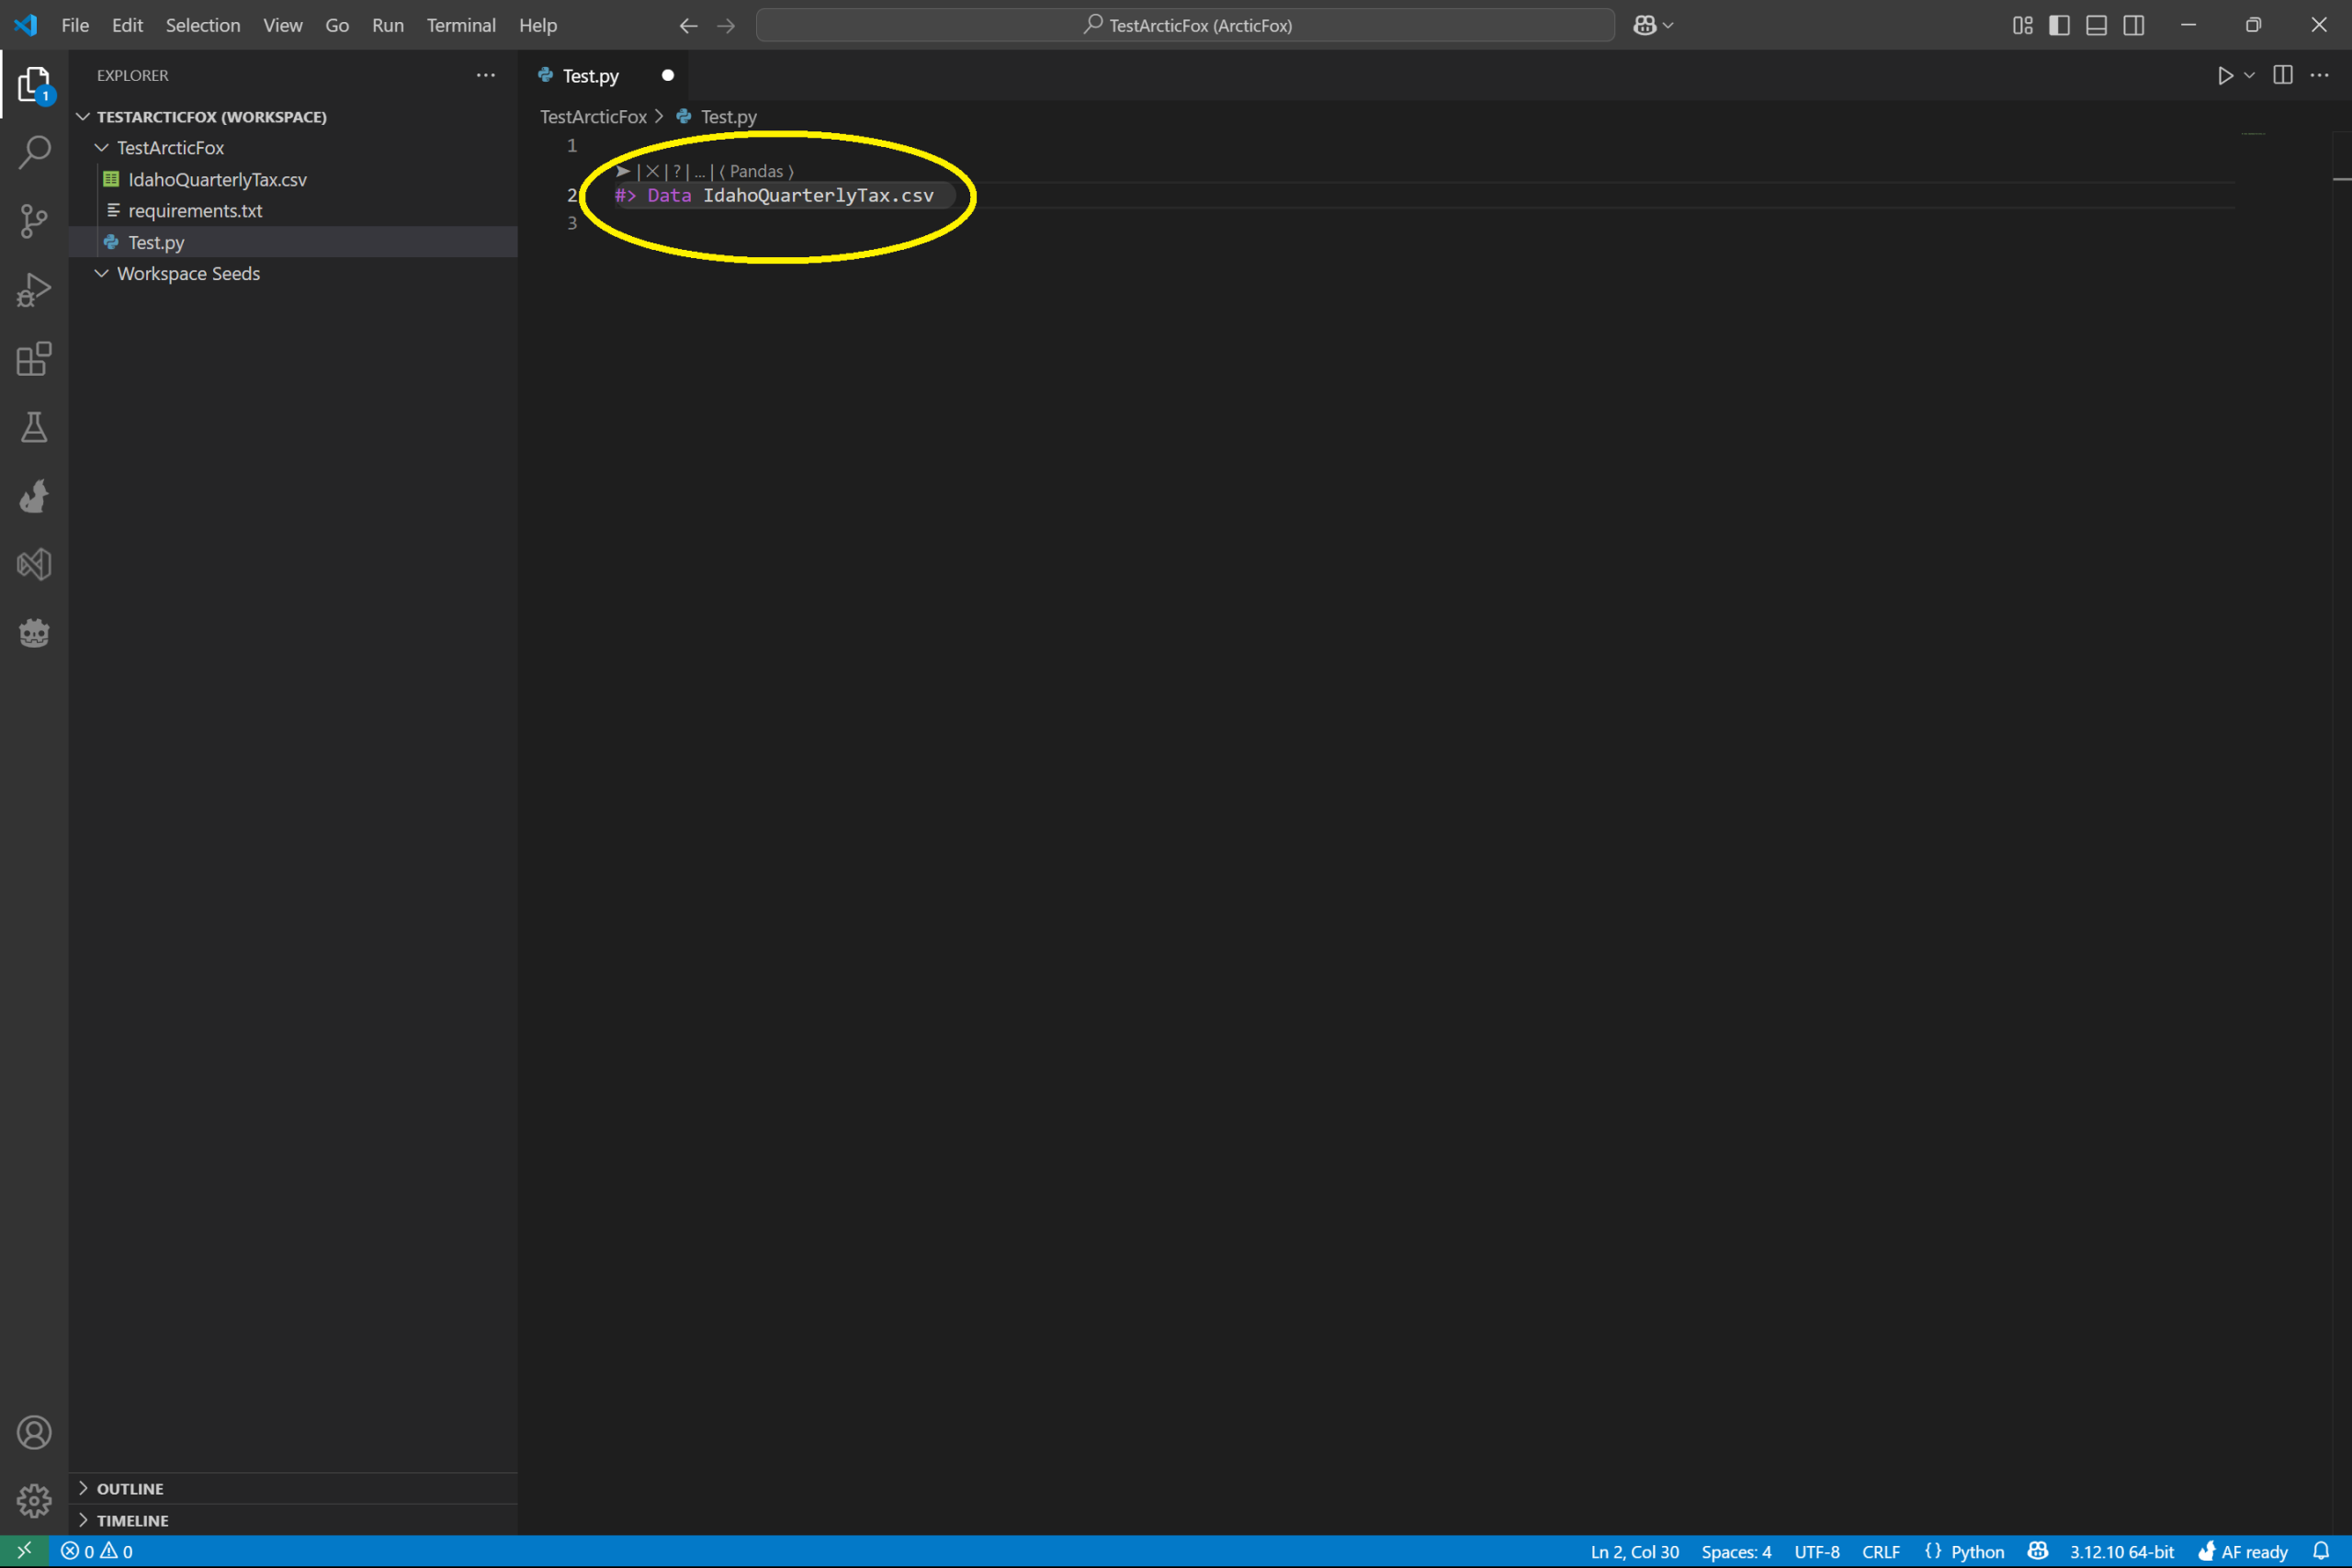
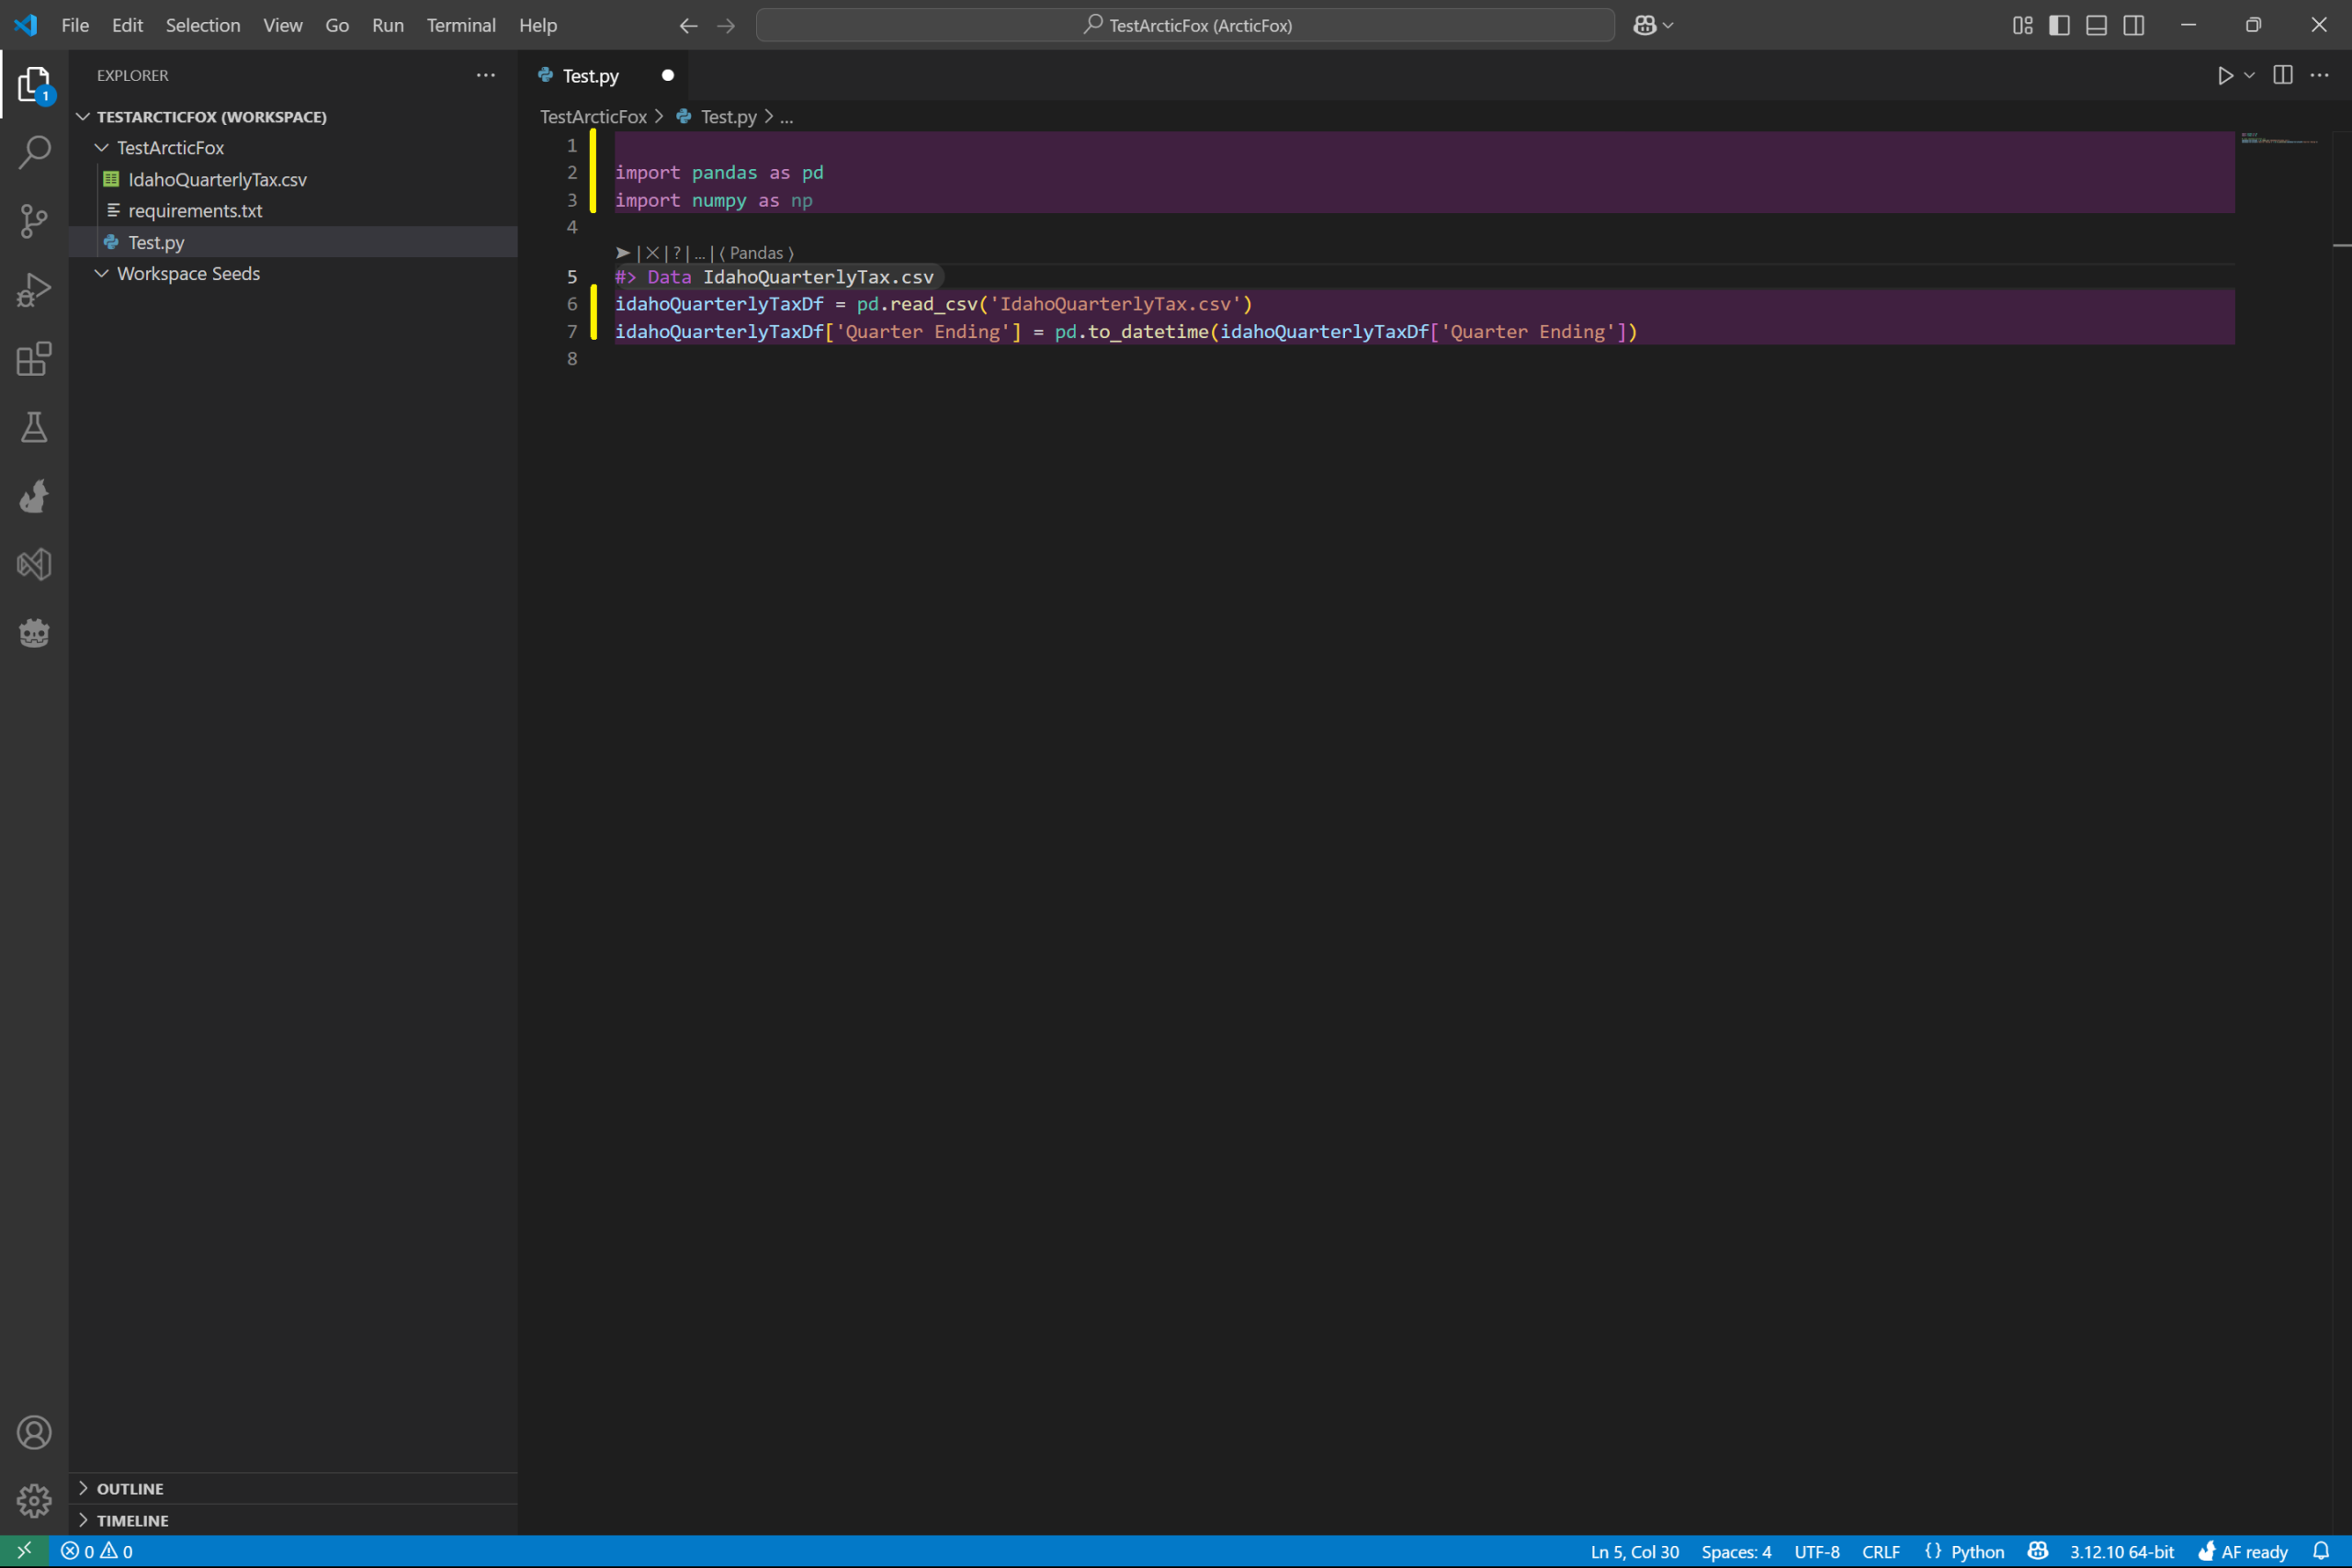
Let the kit fetch its code by either pressing enter on the kit’s line or press the run arrow above the kit. This will result in the kit fetching the code below and adding it the file.
Generated code has a purple background, which can be customized. Additionally, we have placed a yellow line in the image below to identify code that was generated in this step.
Display Column Headers for Easy Use
One of the pains of working with a csv or spreadsheet is constantly looking at the data file to know what the column headers are. To alleviate this nuisance, we created the ColumnHeaders kit, which simply prints the column headers into the file.
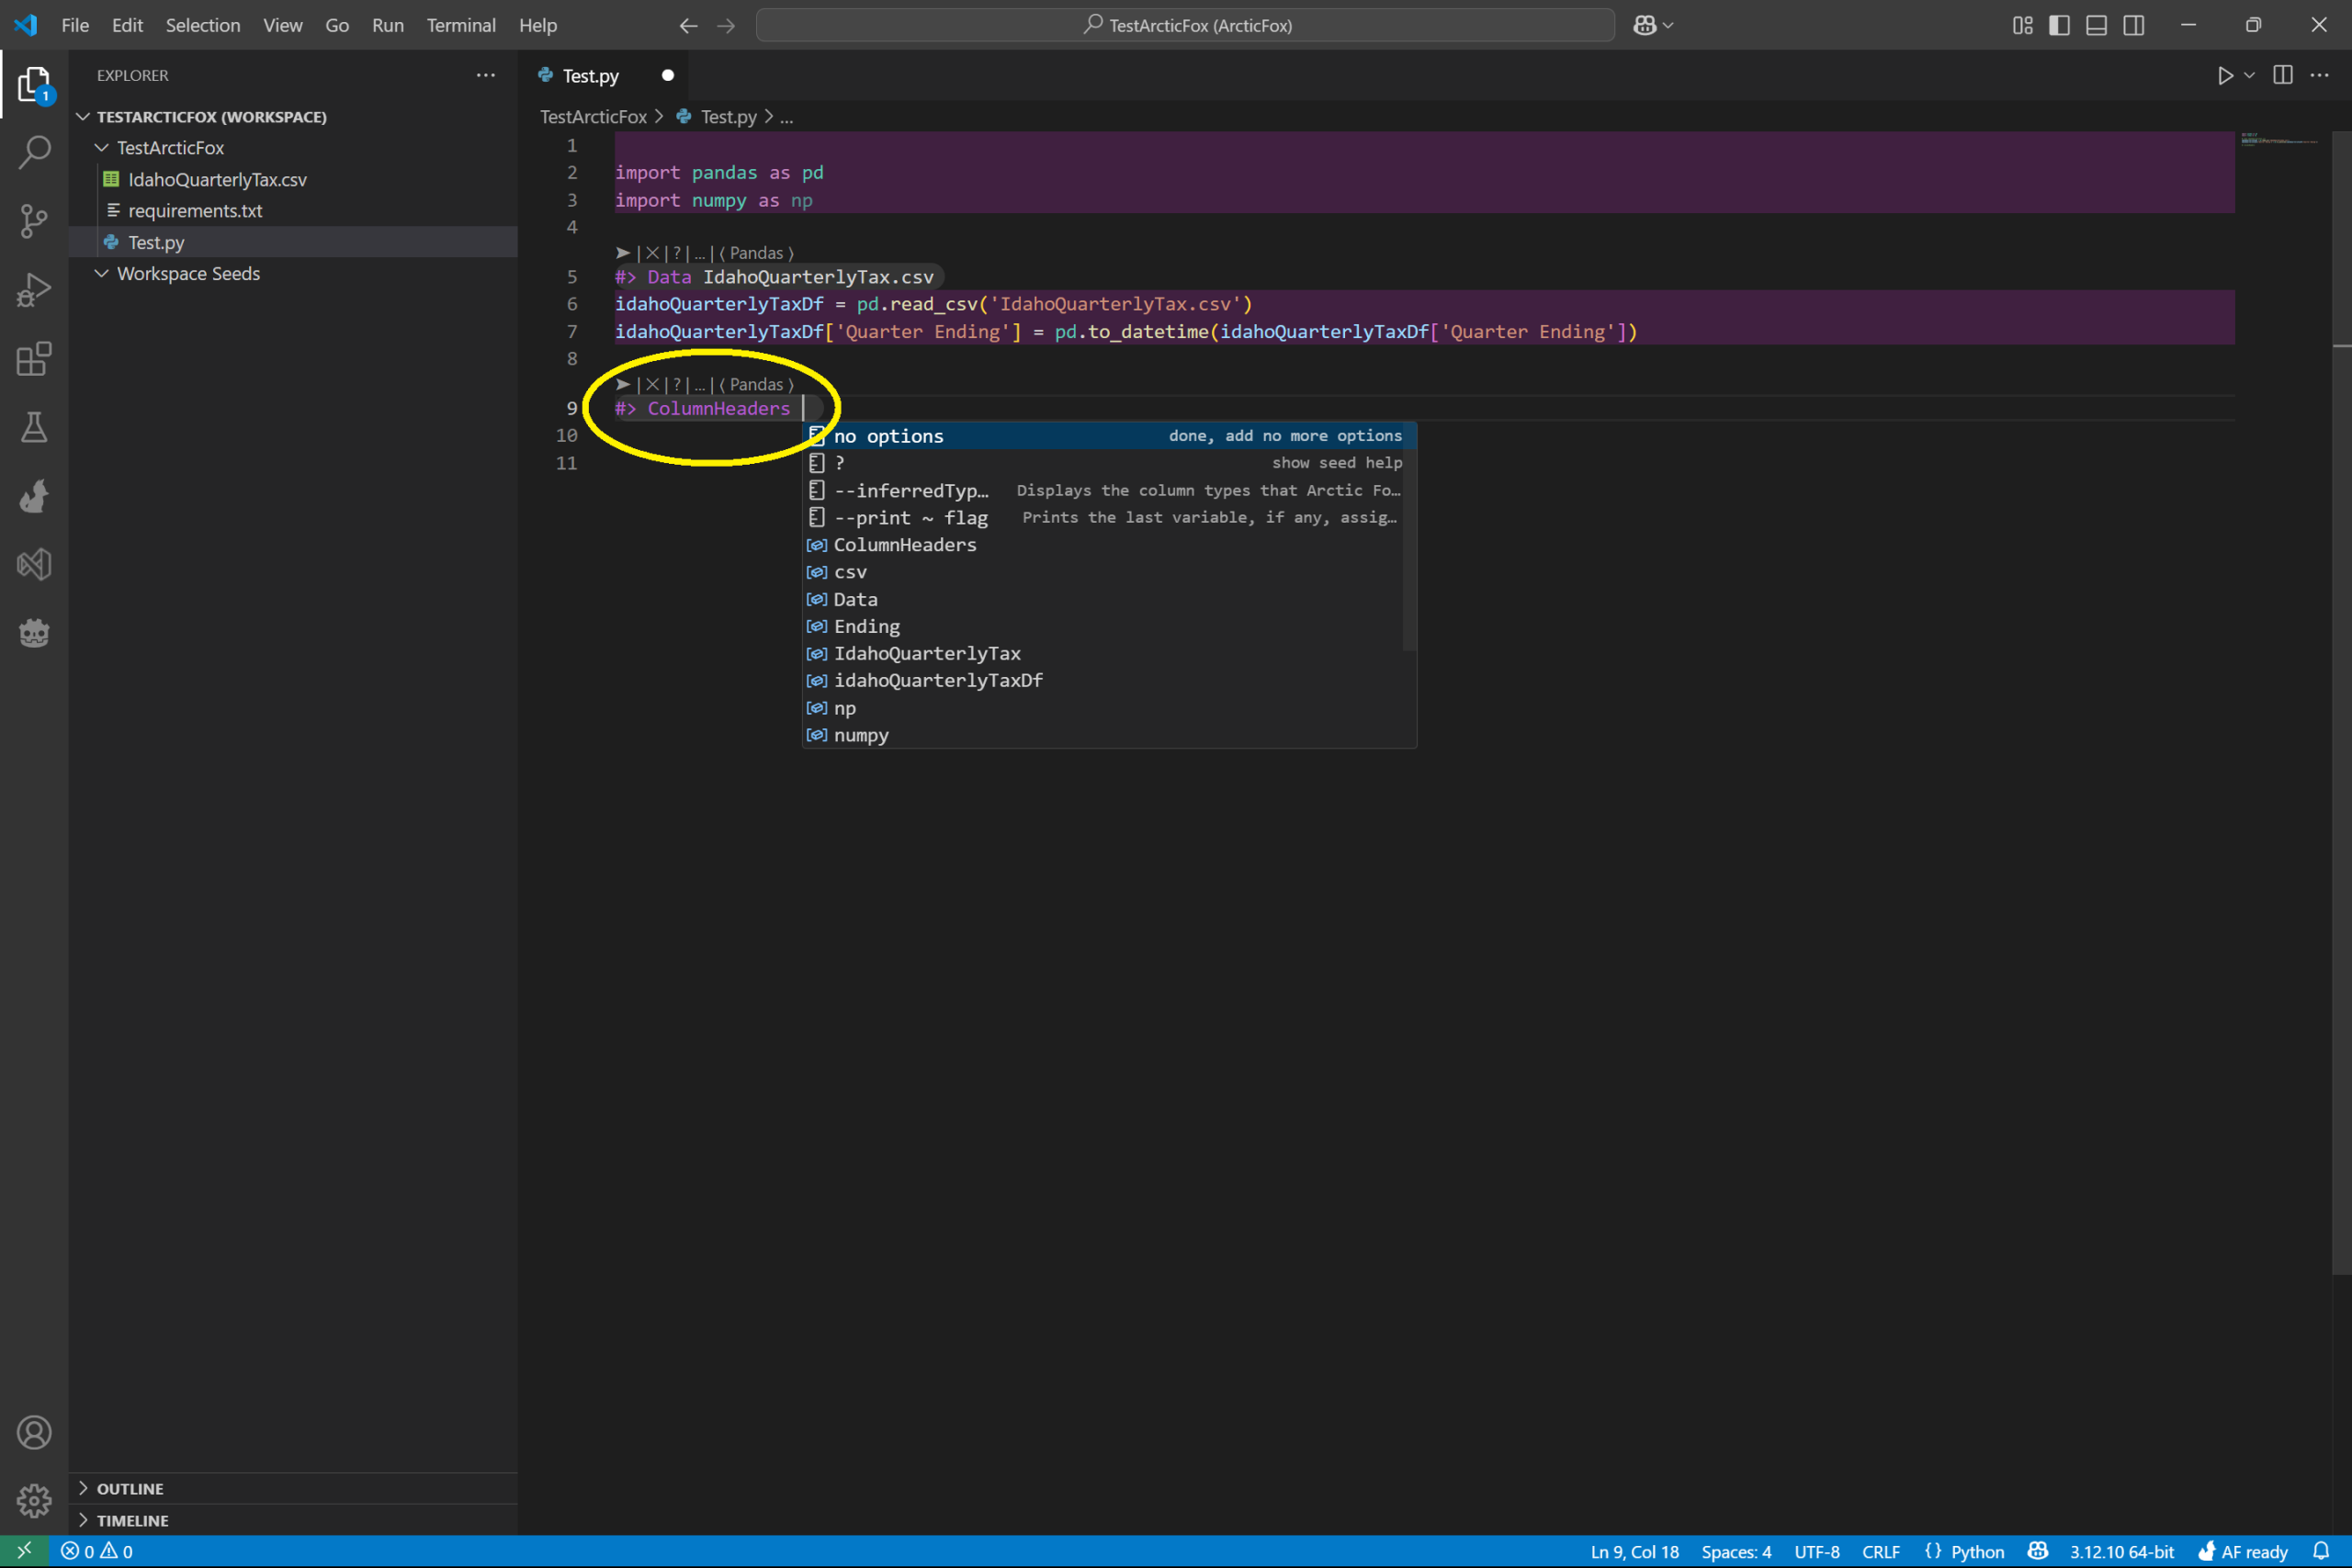
After the generated code from Data, type the word Header. The autocomplete will suggest the ColumnHeaders kit. Press enter with ColumnHeaders highlighted.
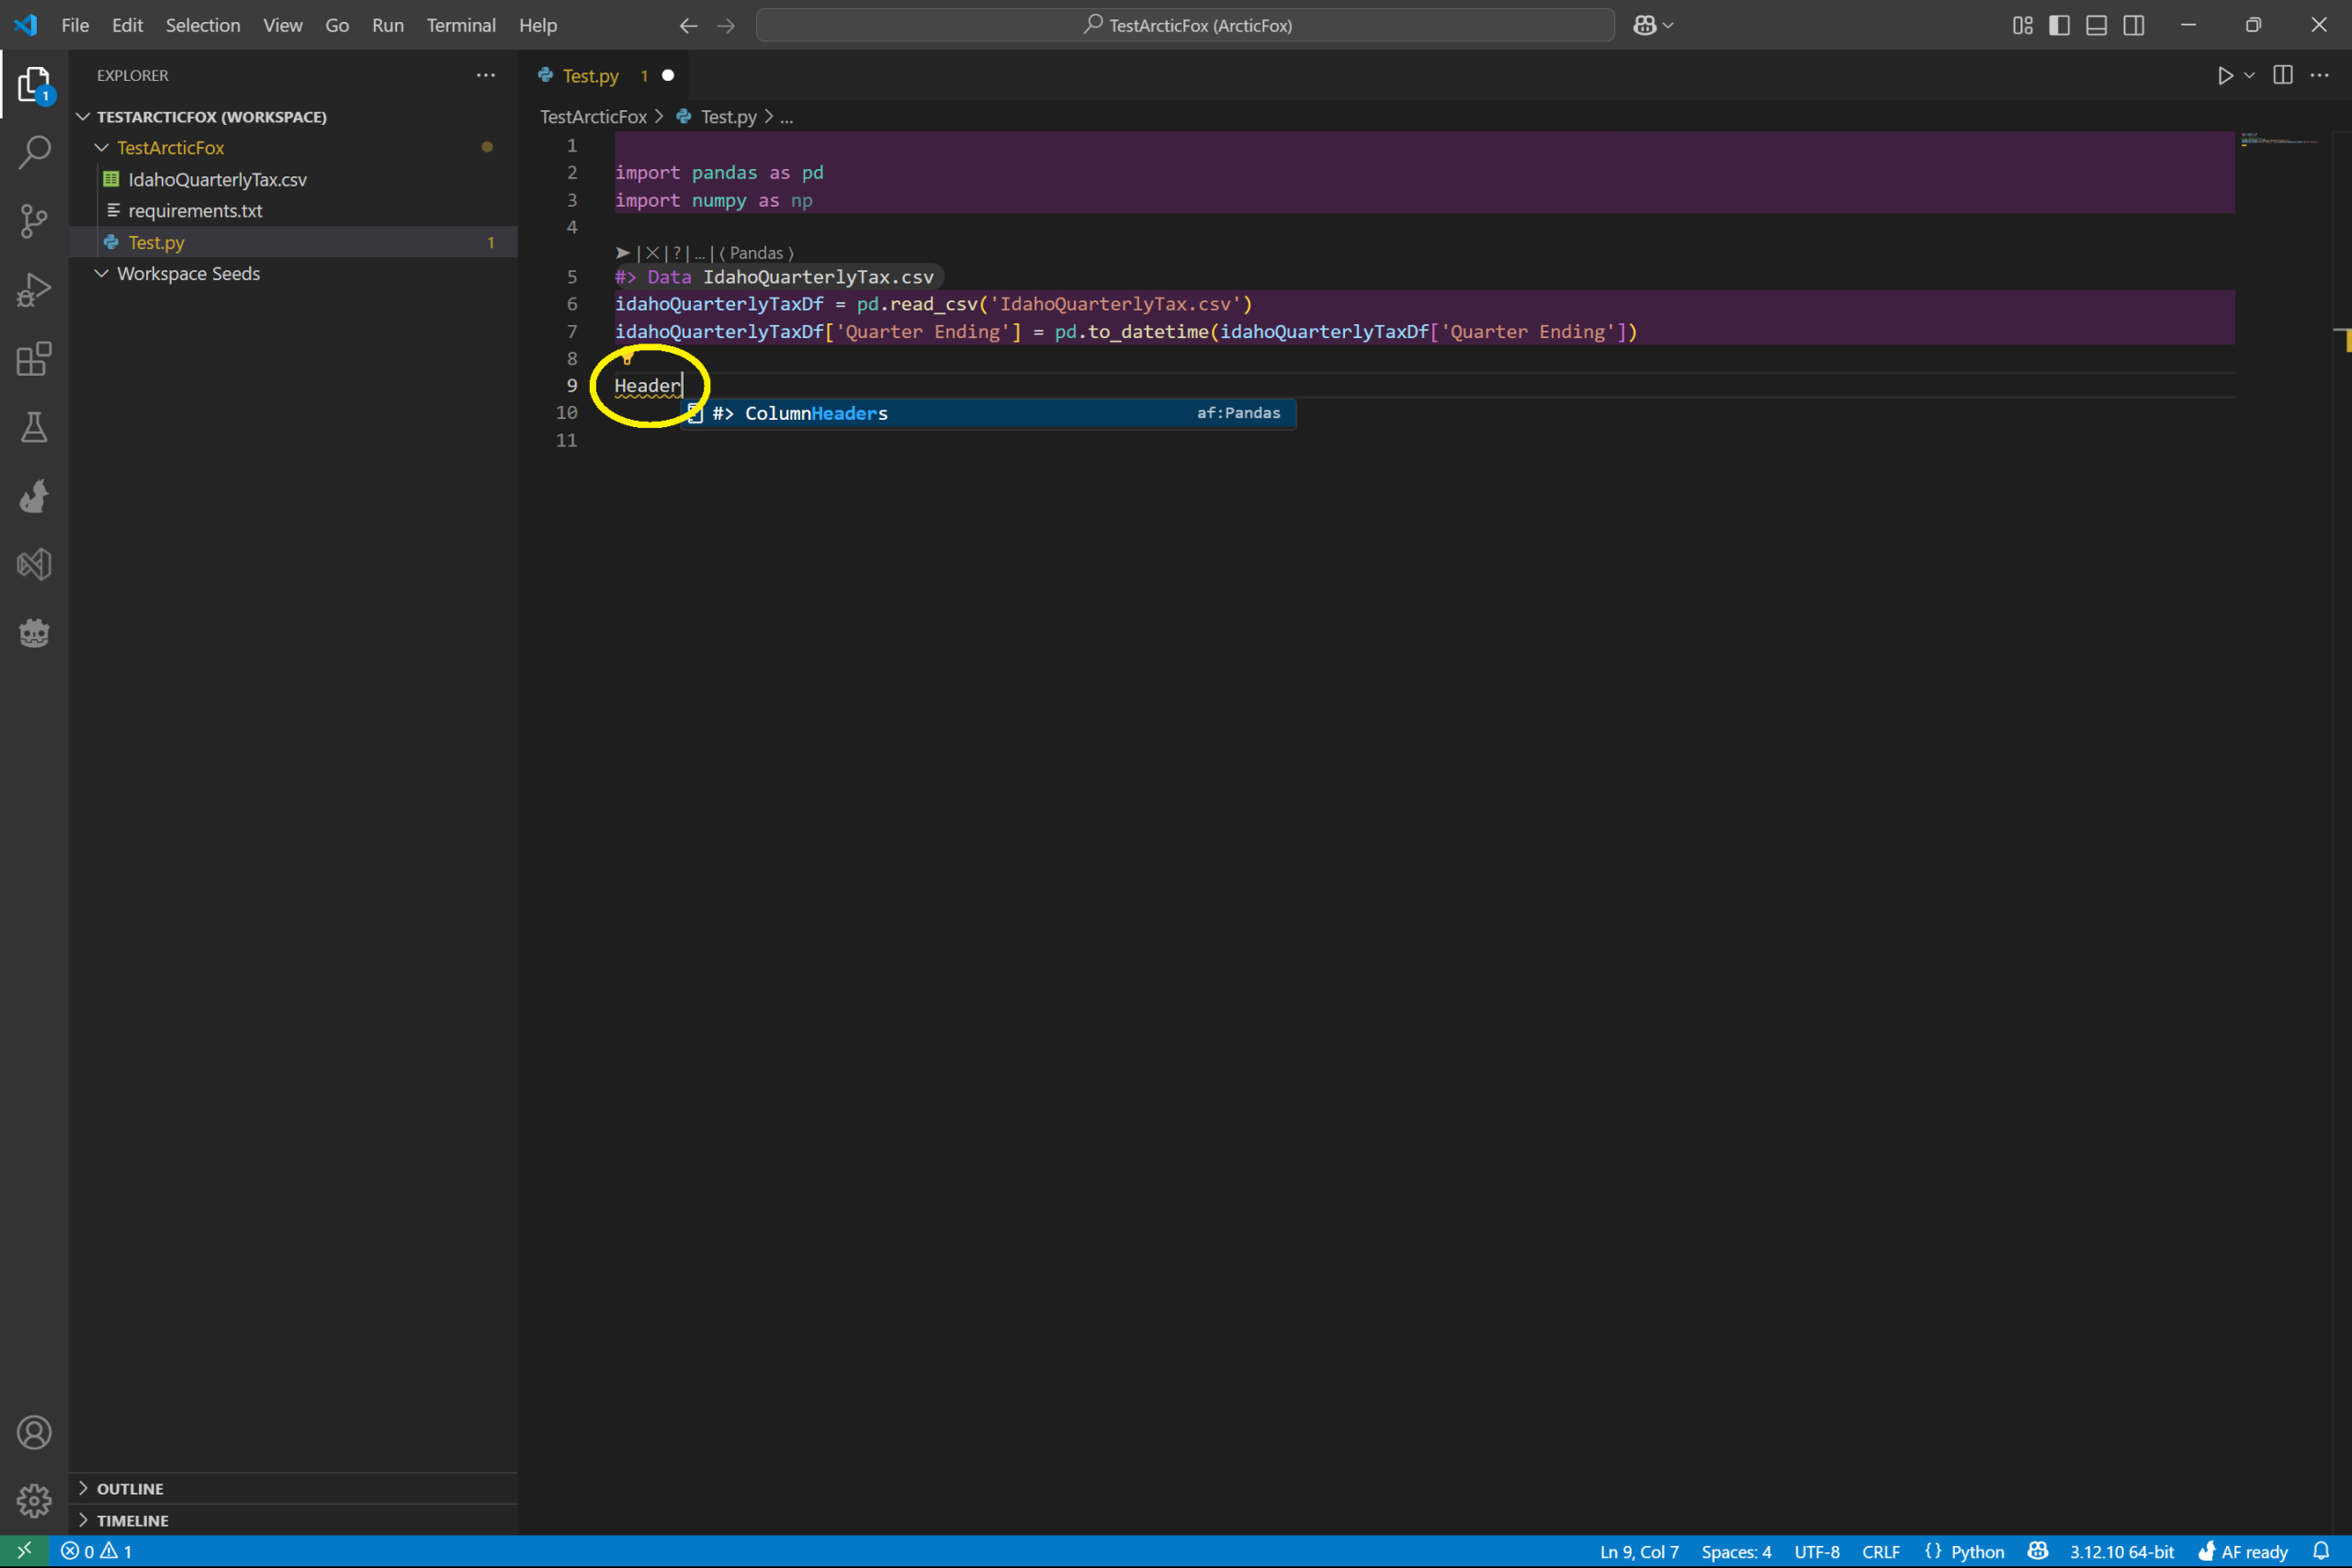
This will replace Header with #> ColumnHeaders. Let the kit fetch code by pressing enter on the ColumnHeaders line or pressing the run arrow above it.
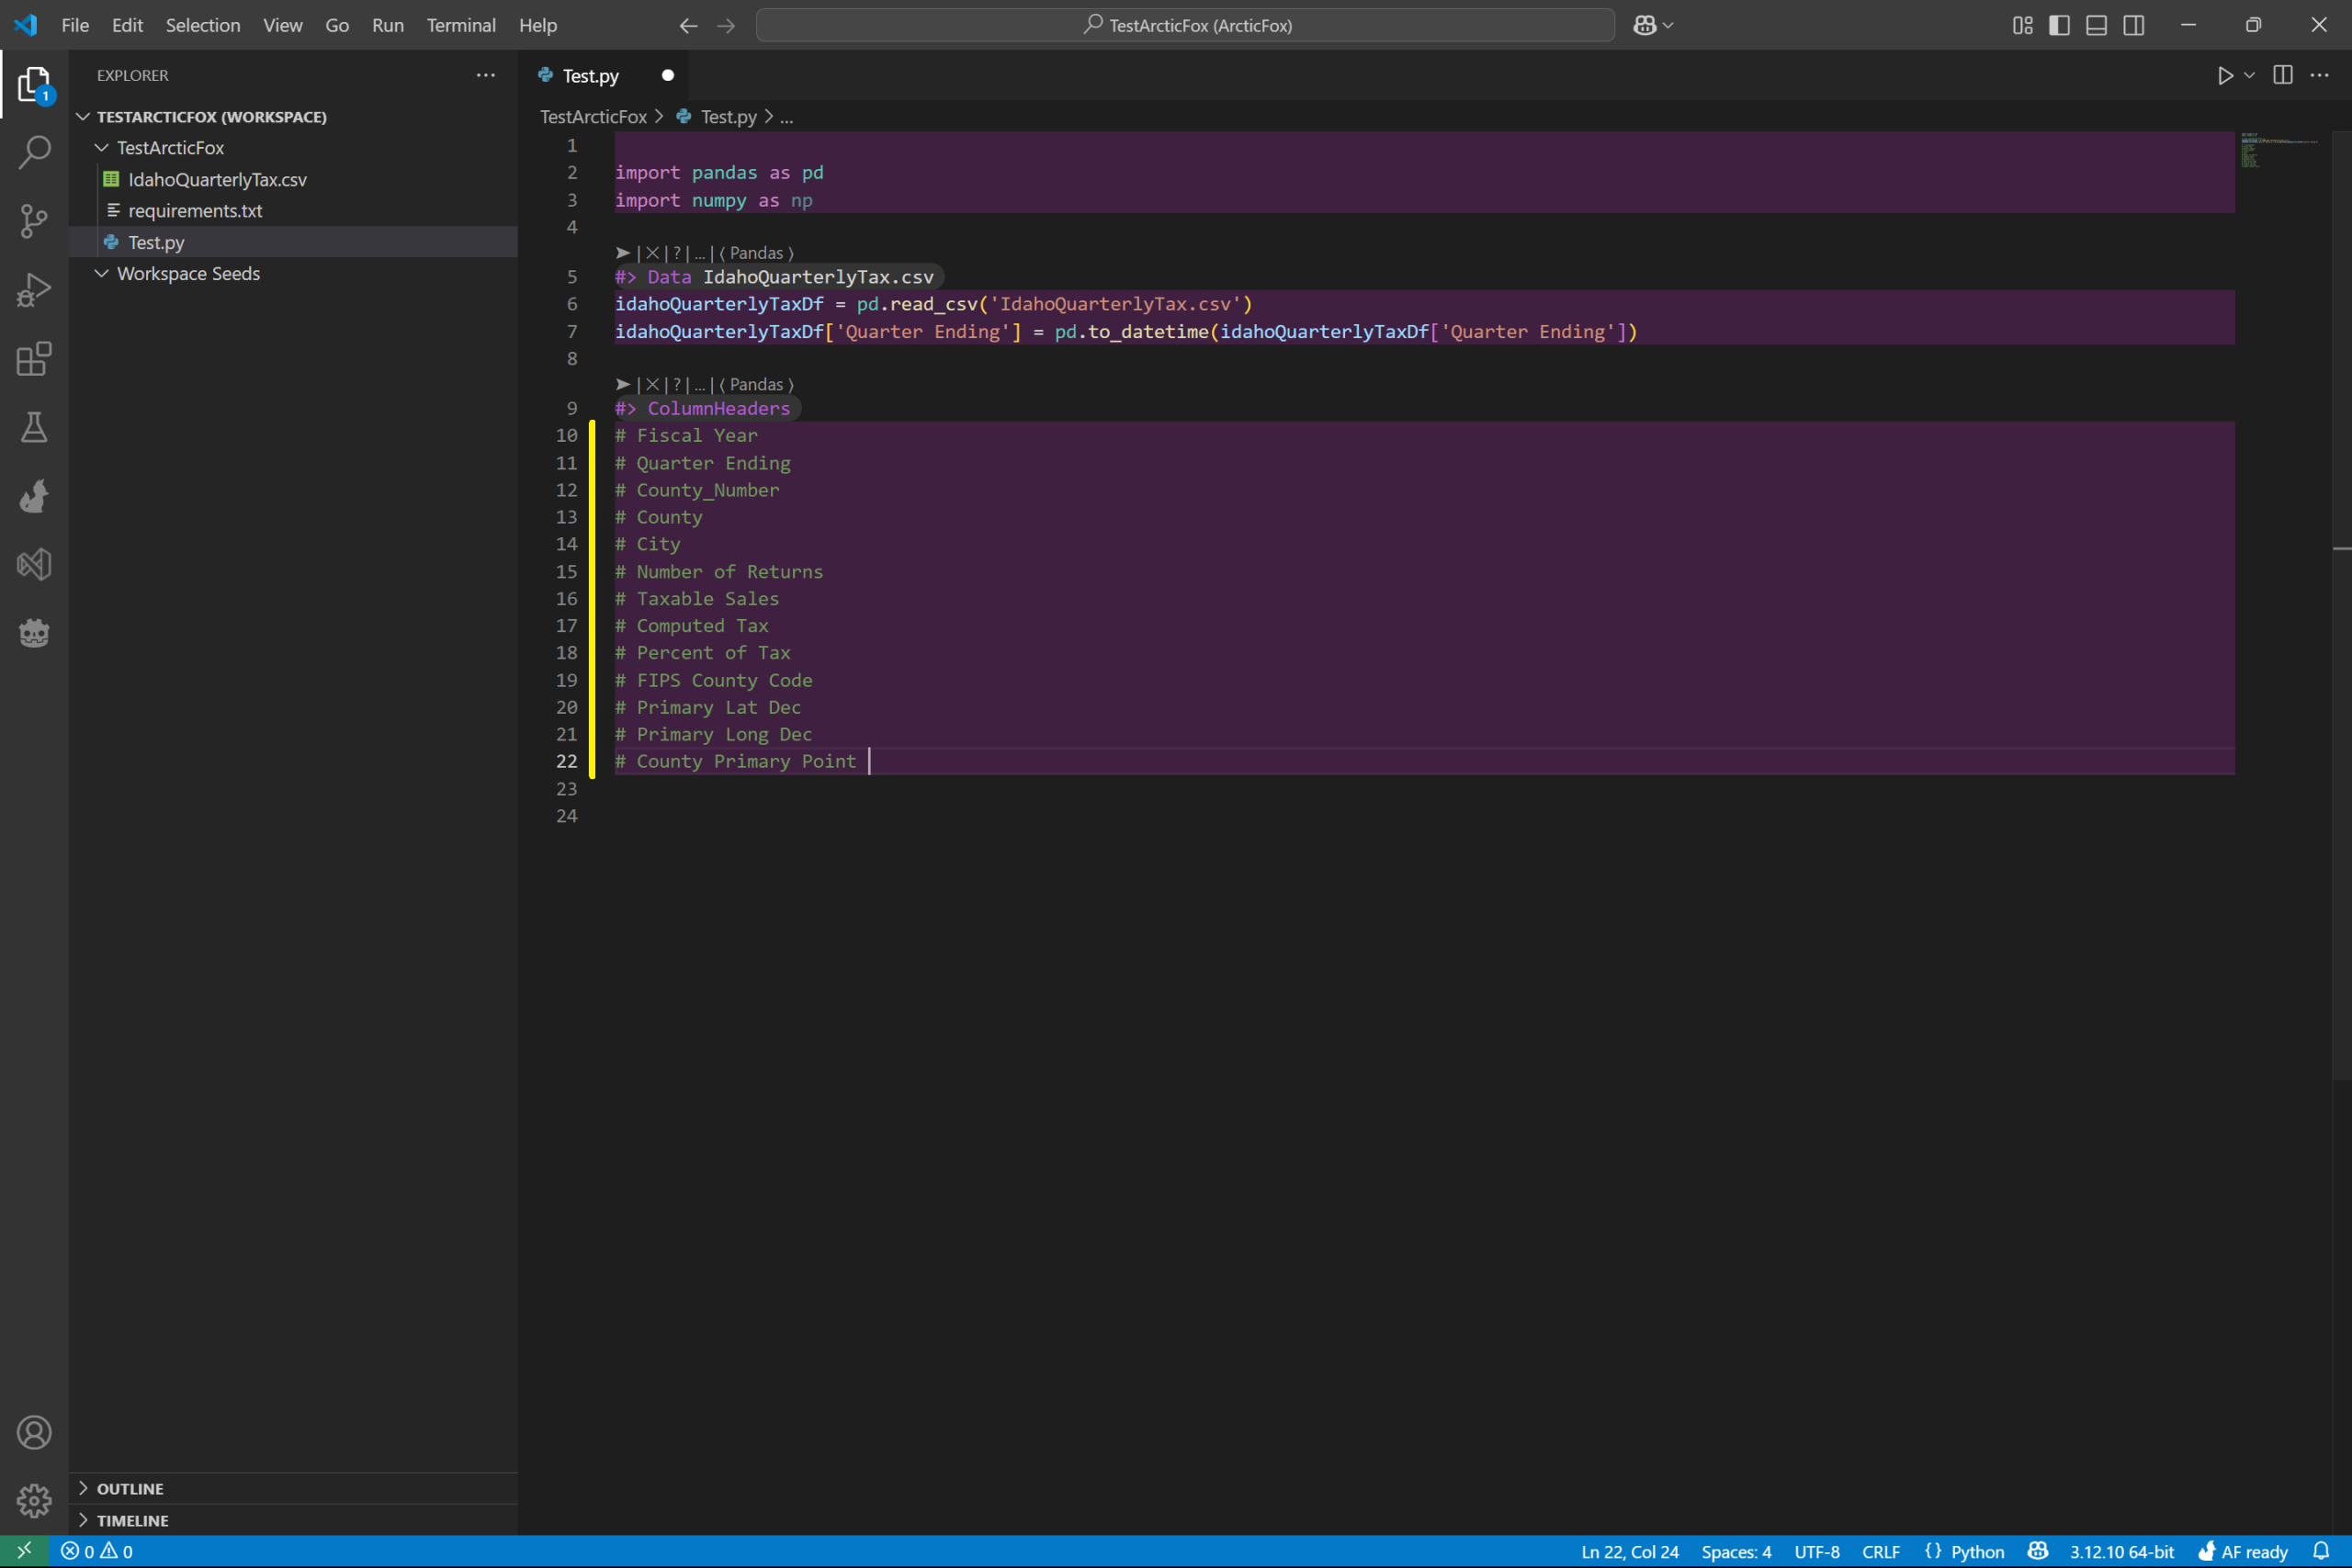
After the ColumnHeaders finishes fetching, you should see the headers written into the file as seen below. This will make it easier to reference which headers to use in the code.
Visualize the Data as a Table
Another kit we use often is the Visualize kit. It is flexible and adapts to the environment, such as a python file, jupyter notebook, or active excel file.
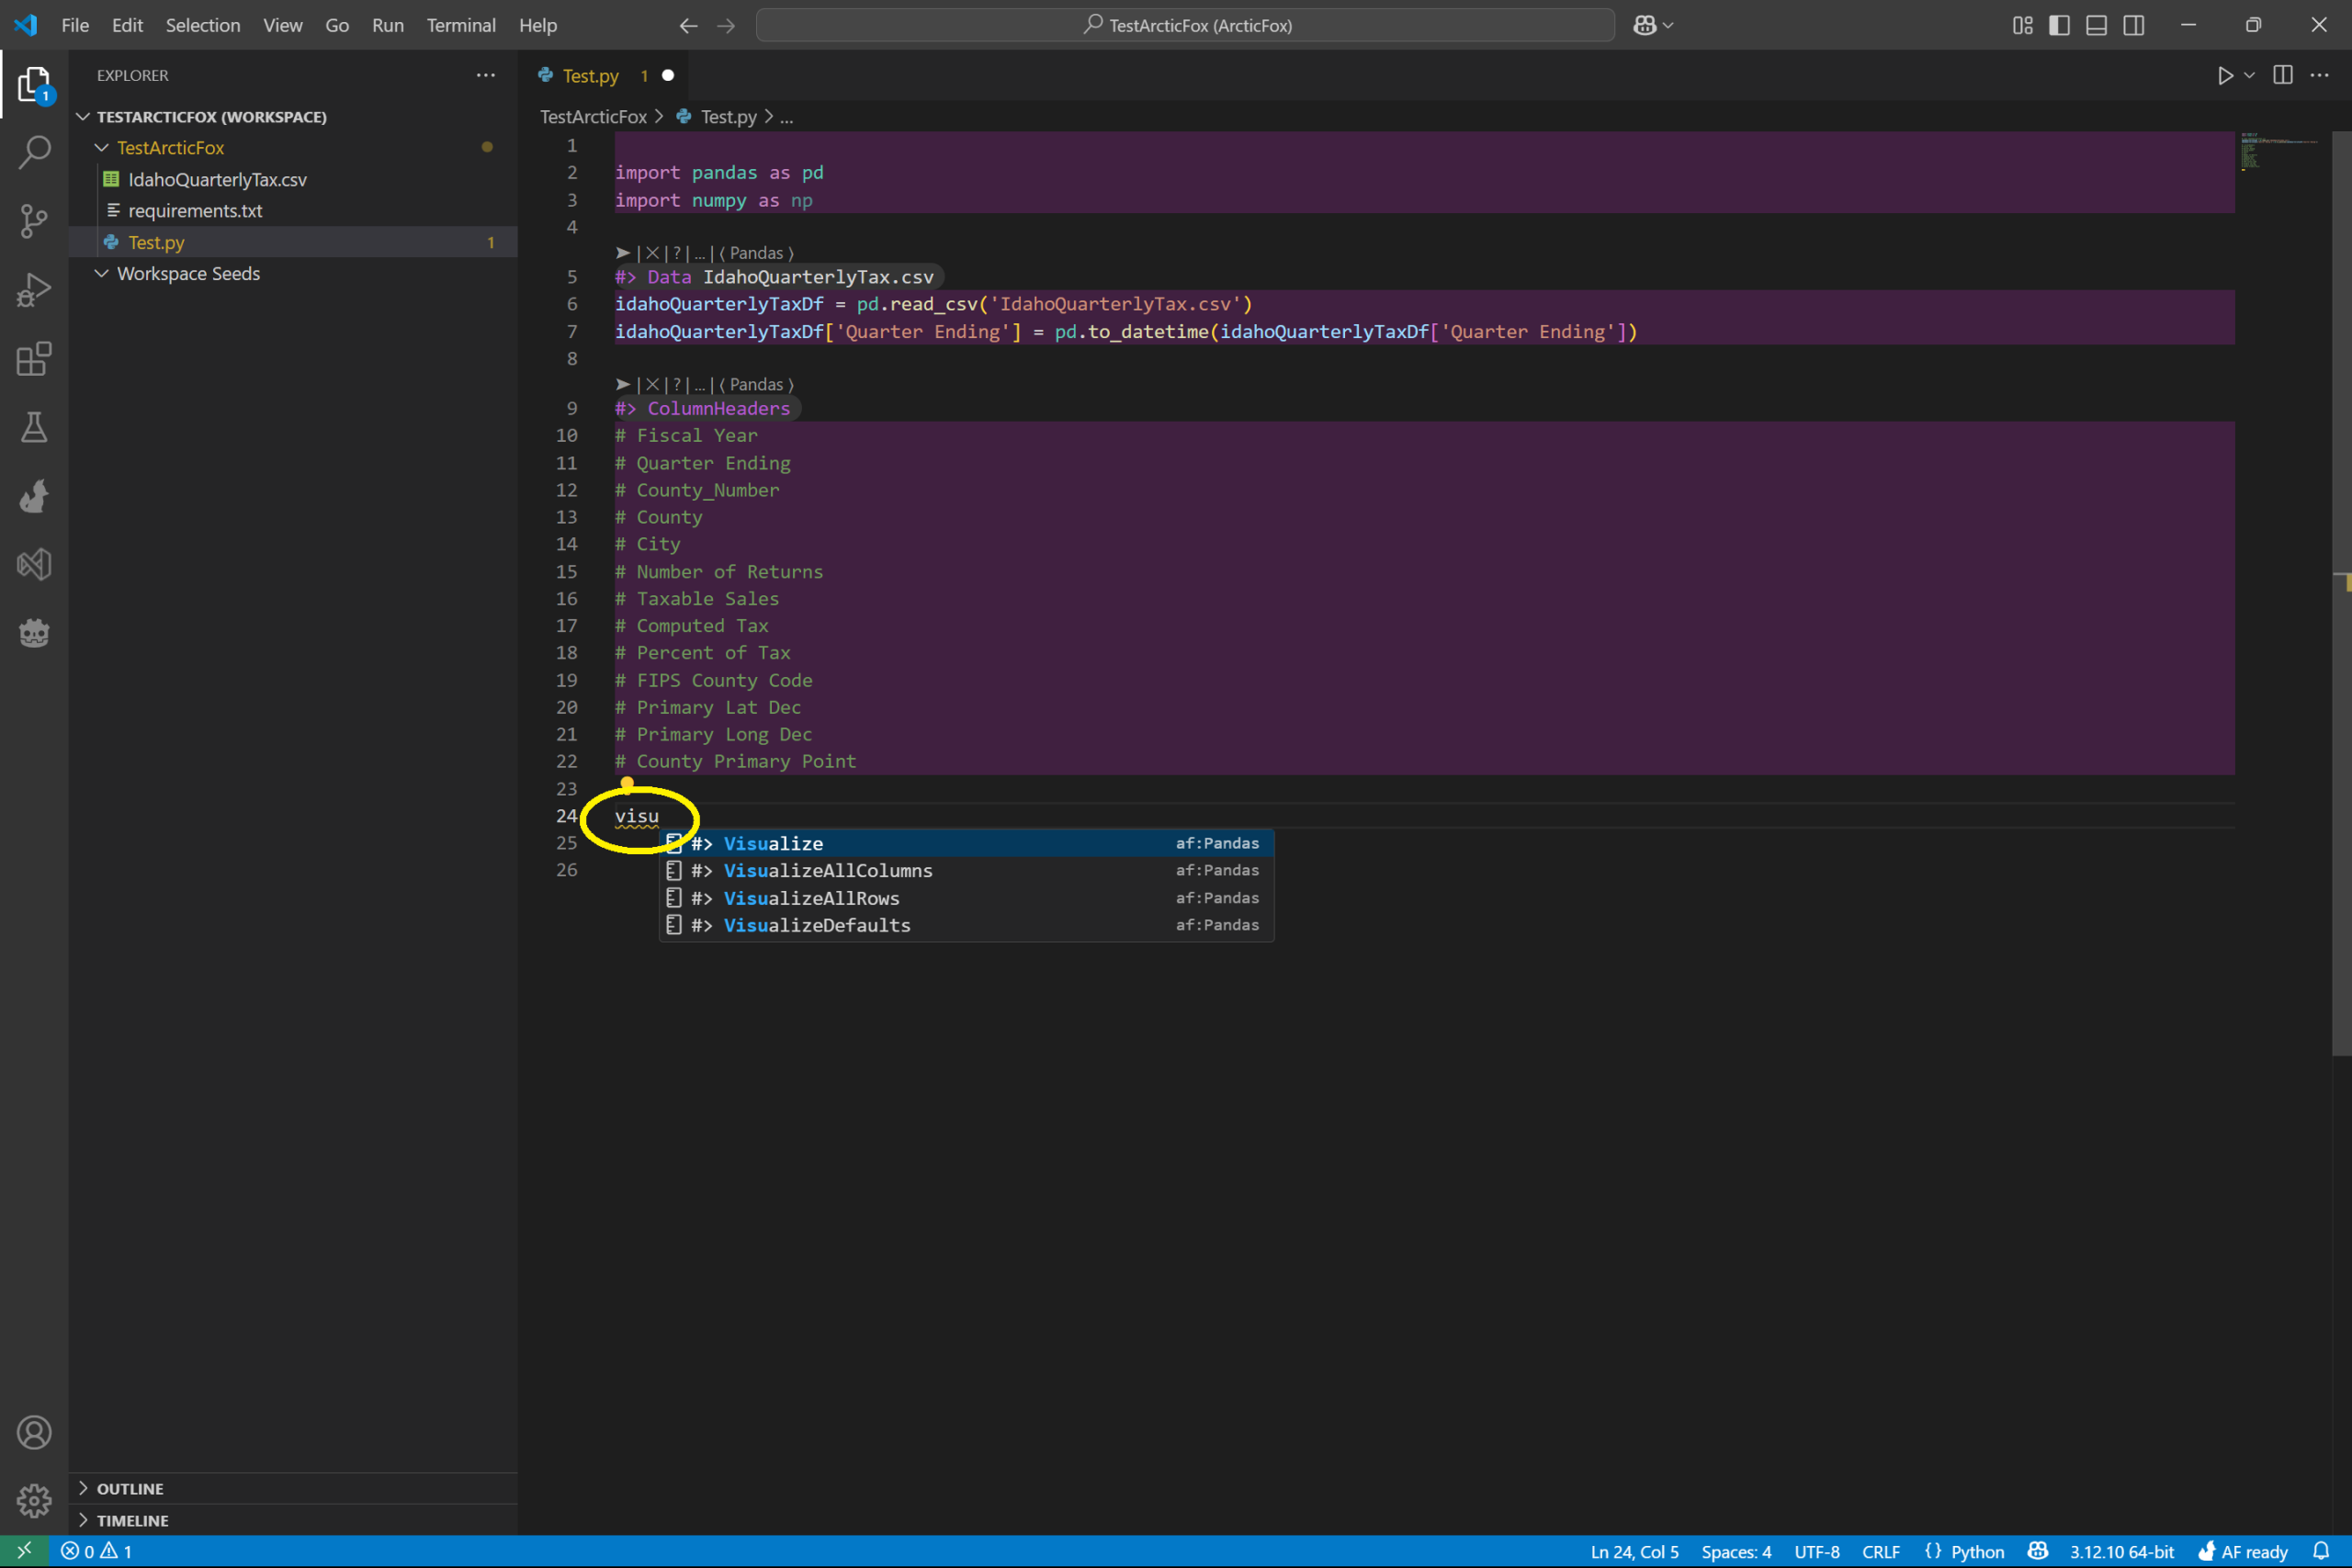
Following the same process, after the generated code from ColumnHeaders, type Visualize. Press enter with Visualize highlighted in the autocomplete.
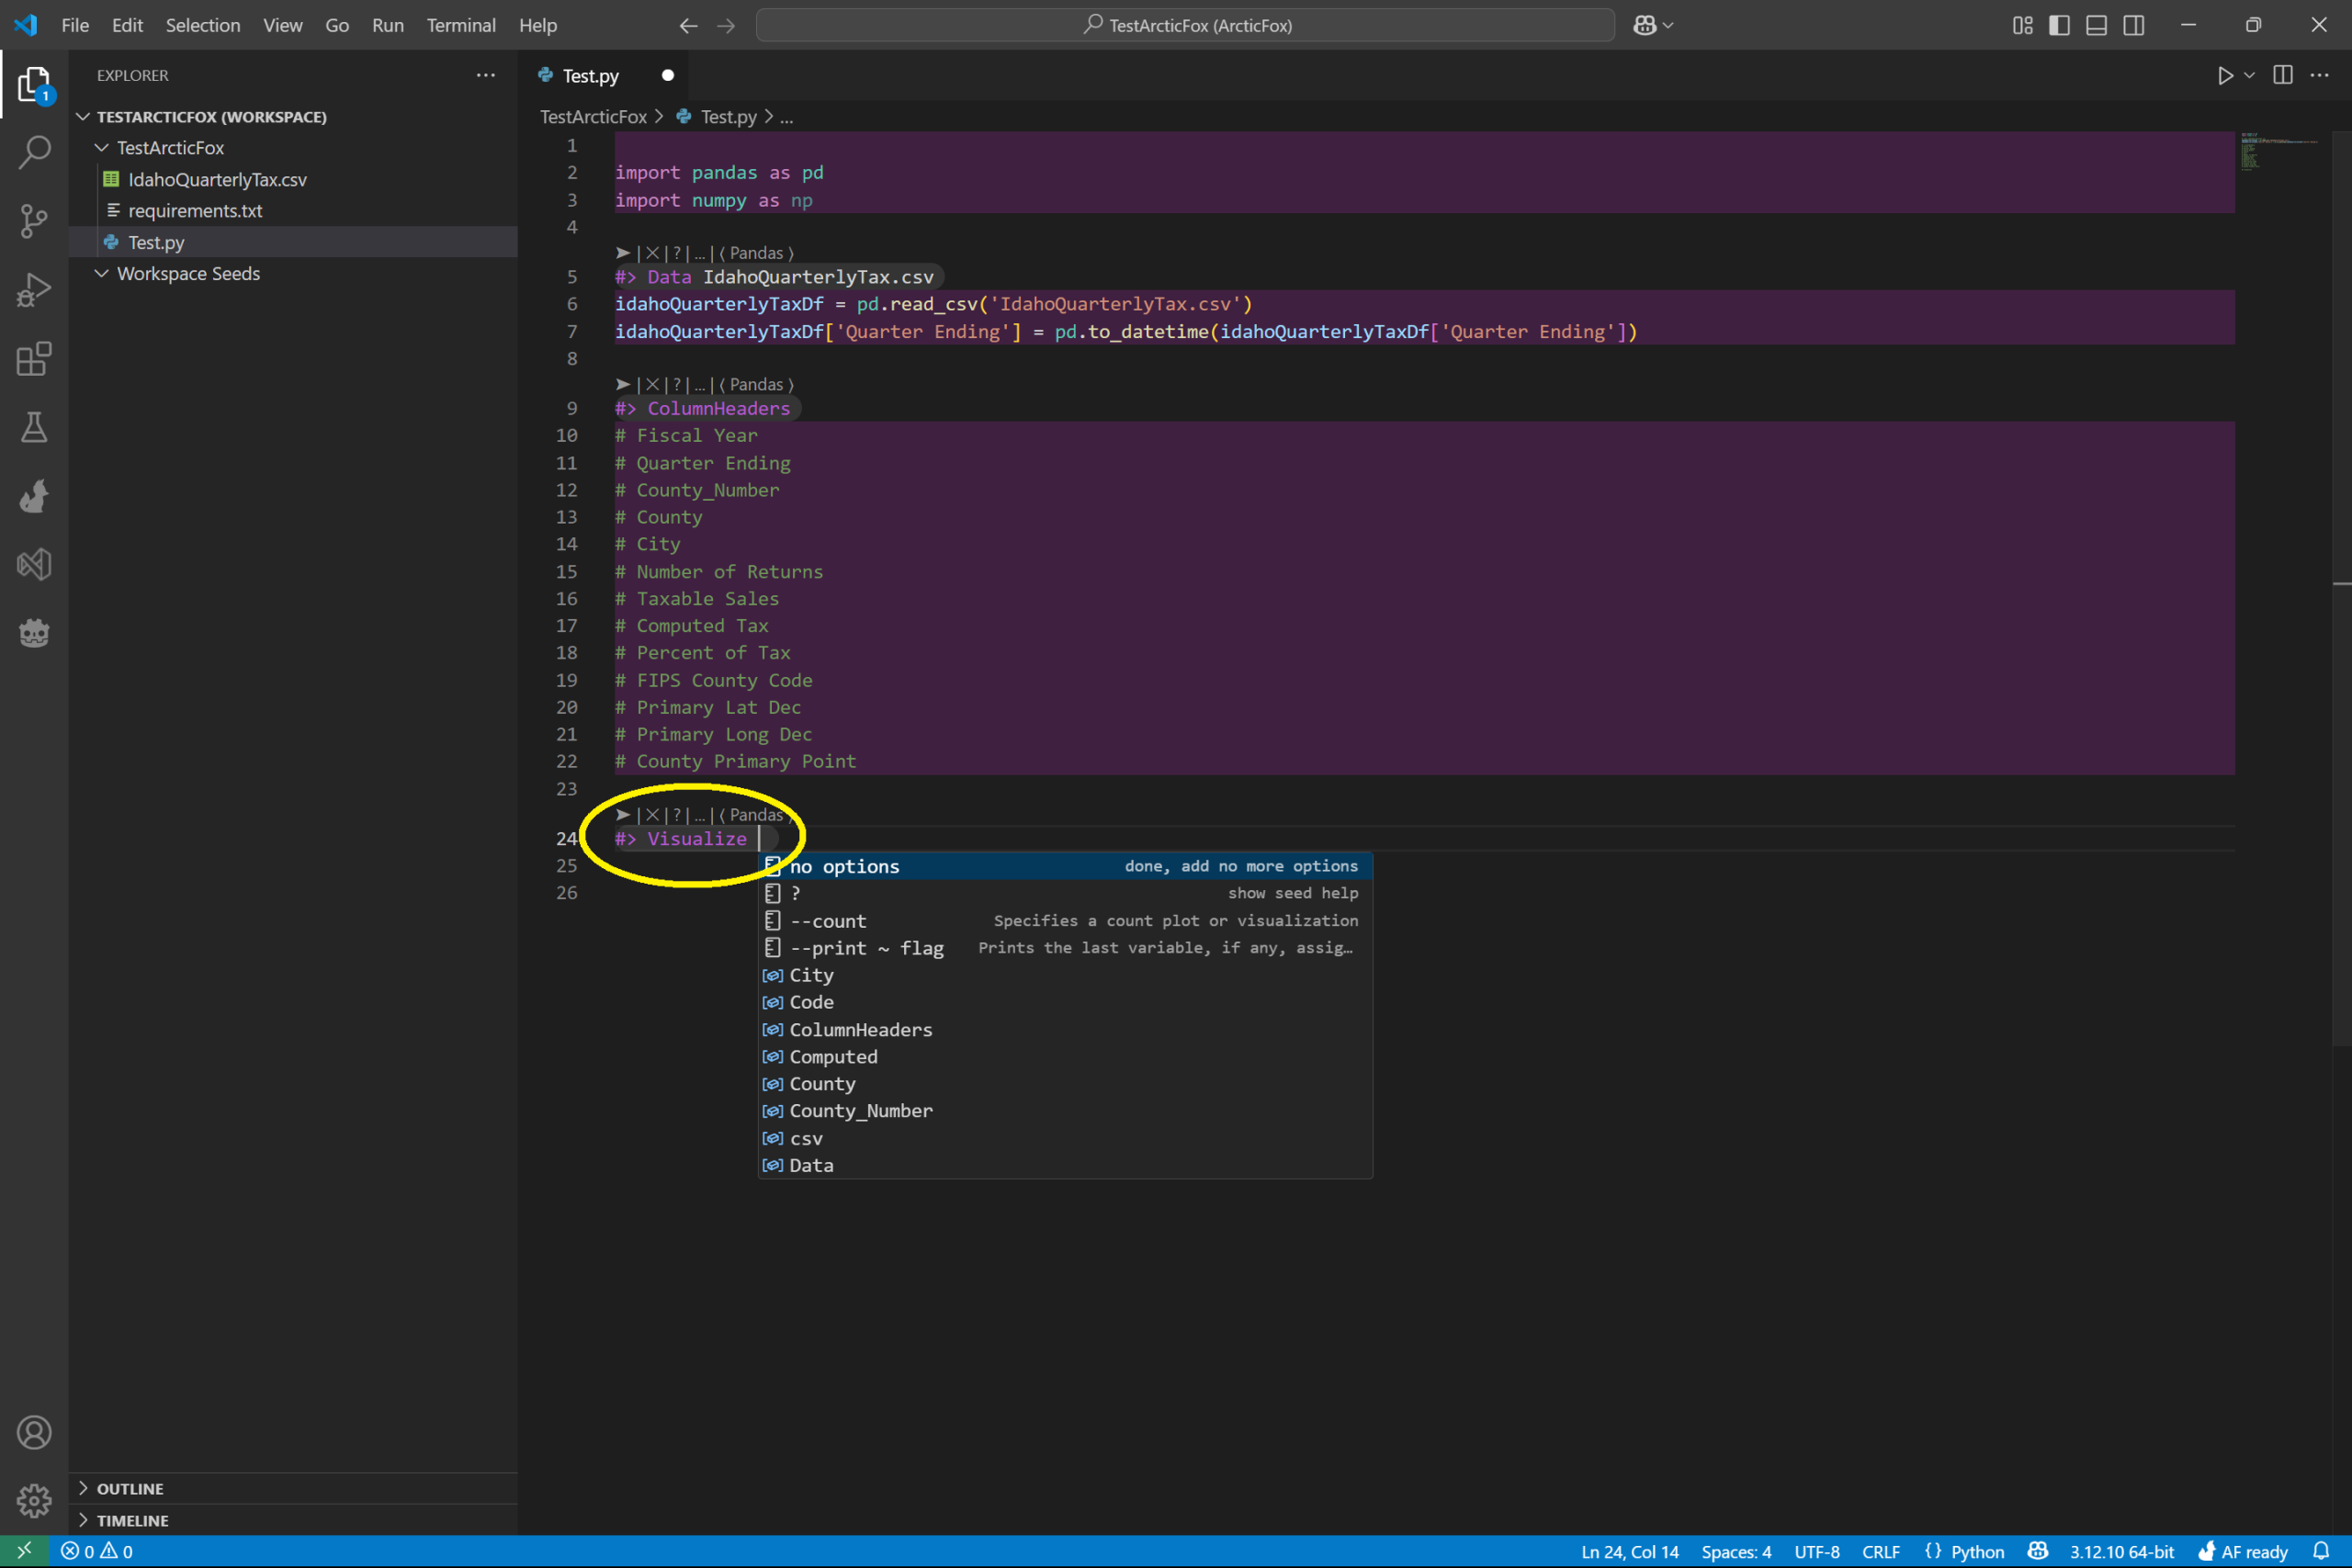
Press enter on the line, or press the arrow above Visualize, to run the kit.
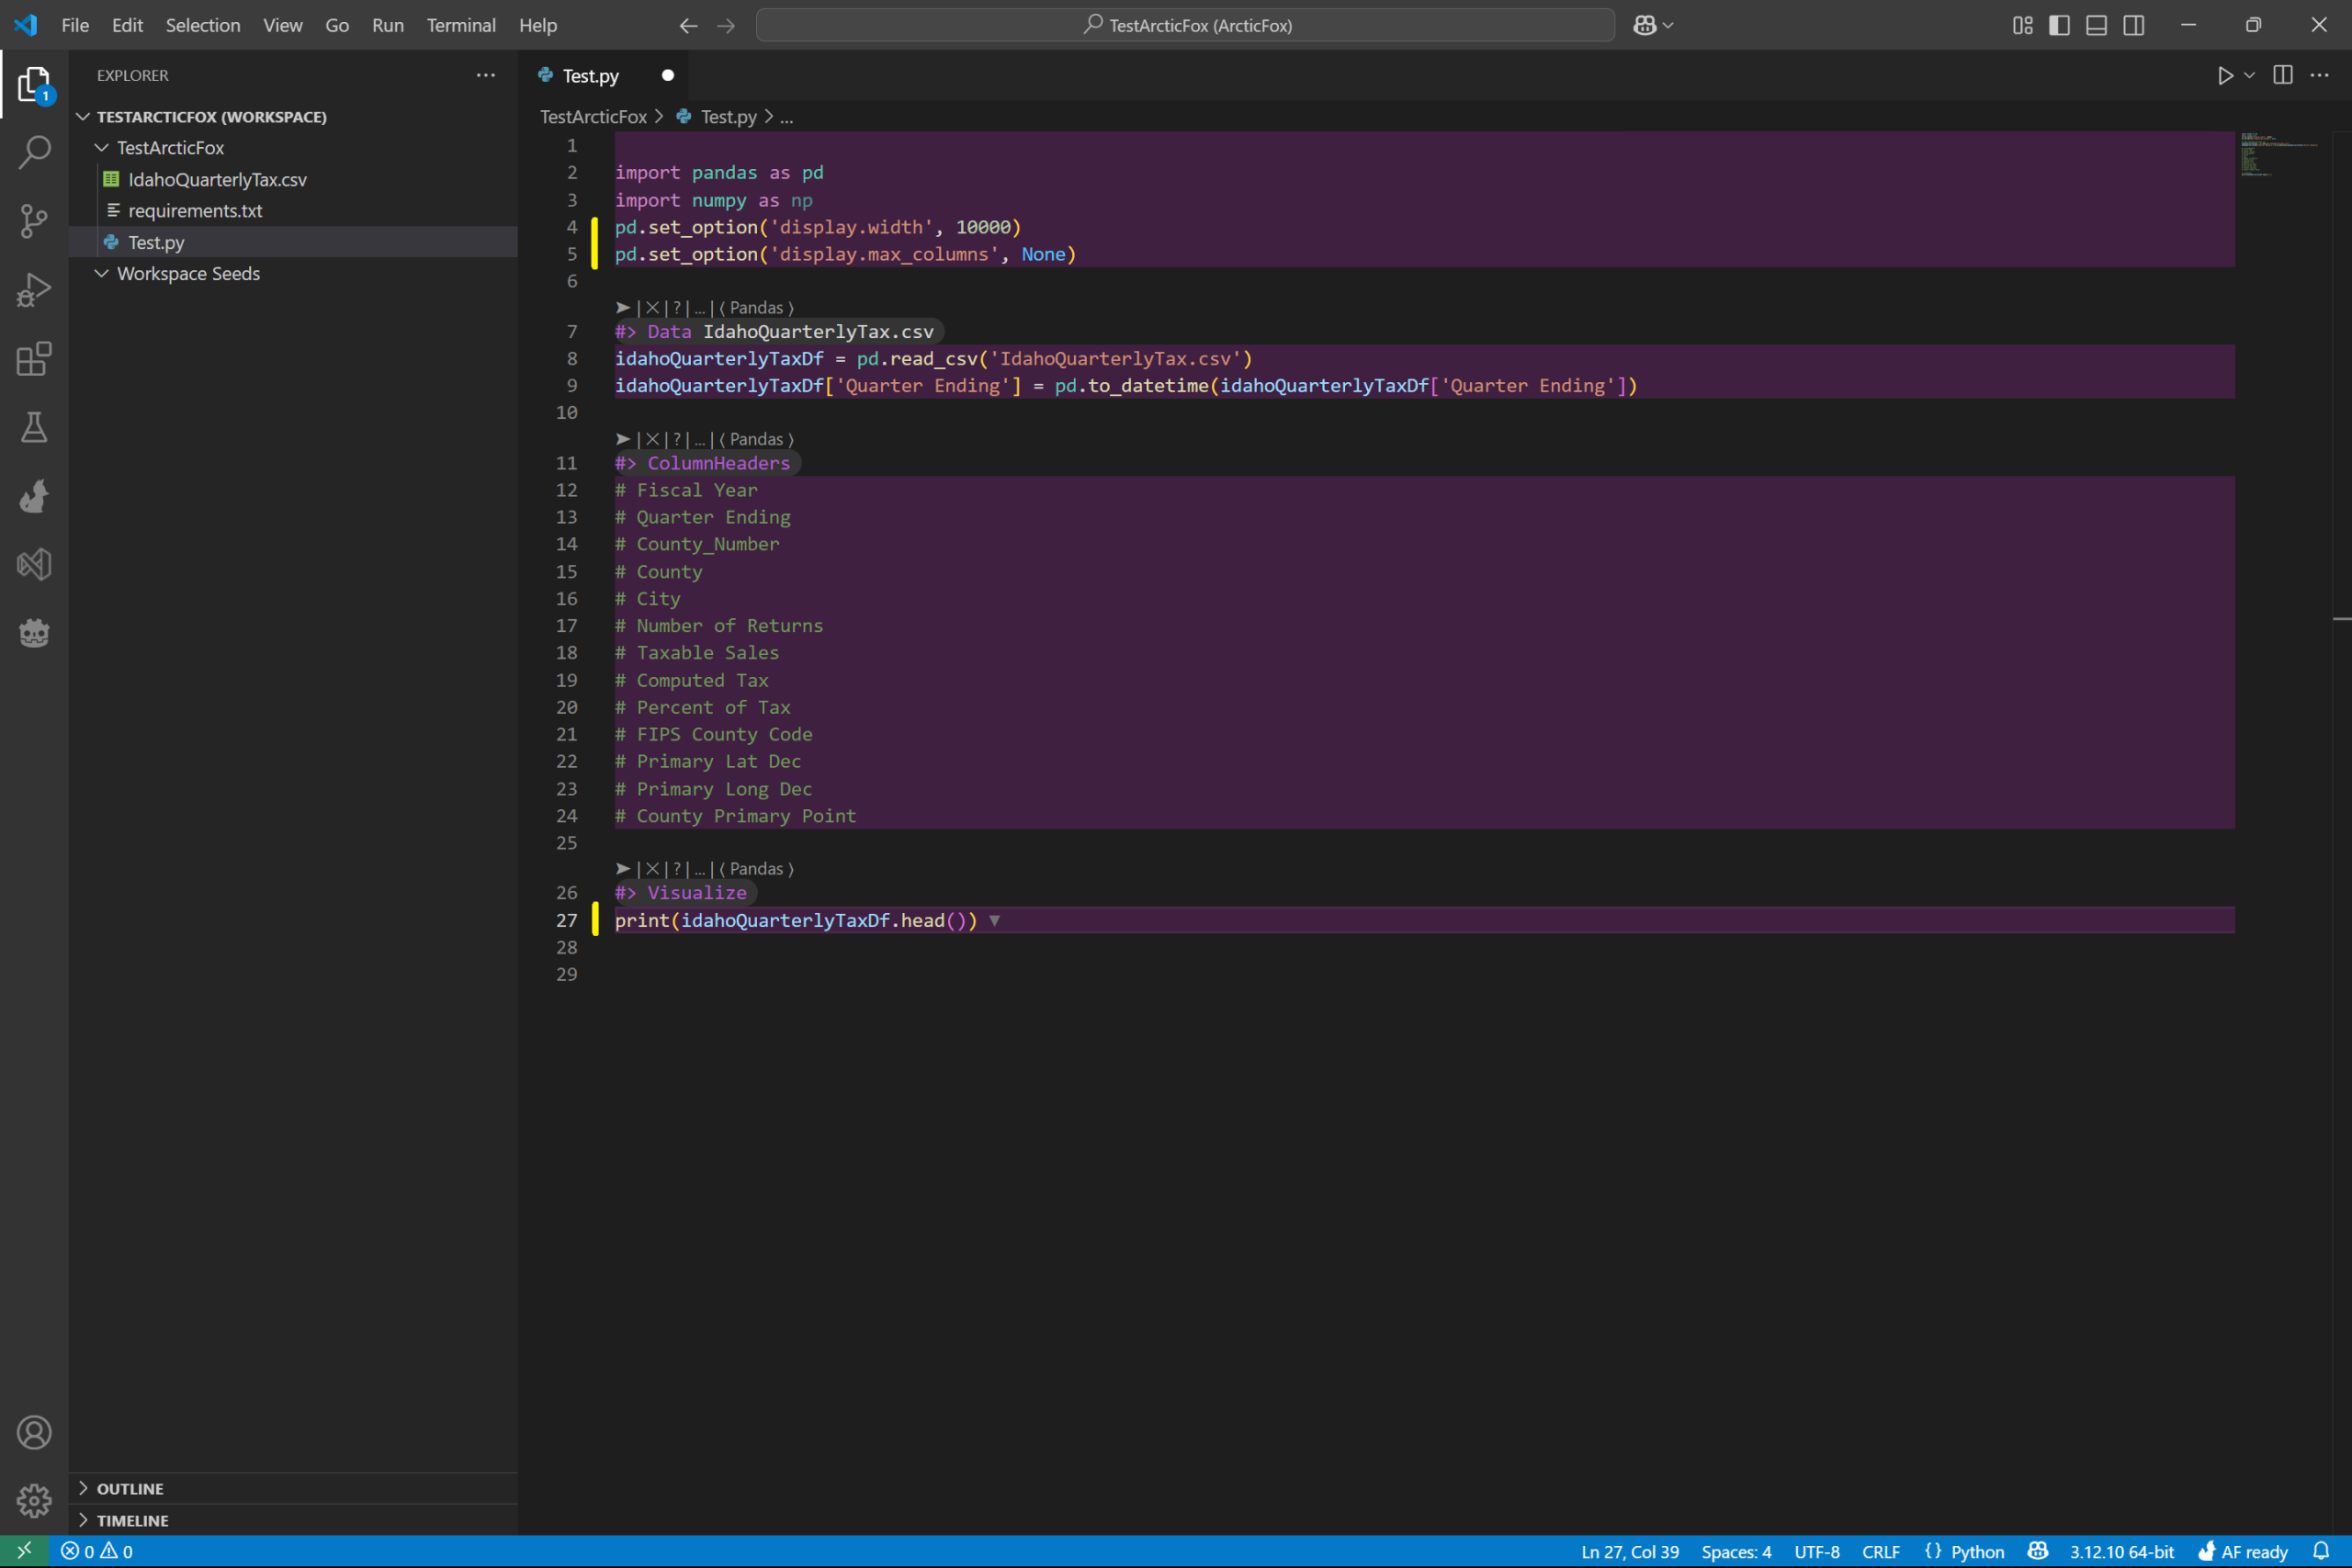
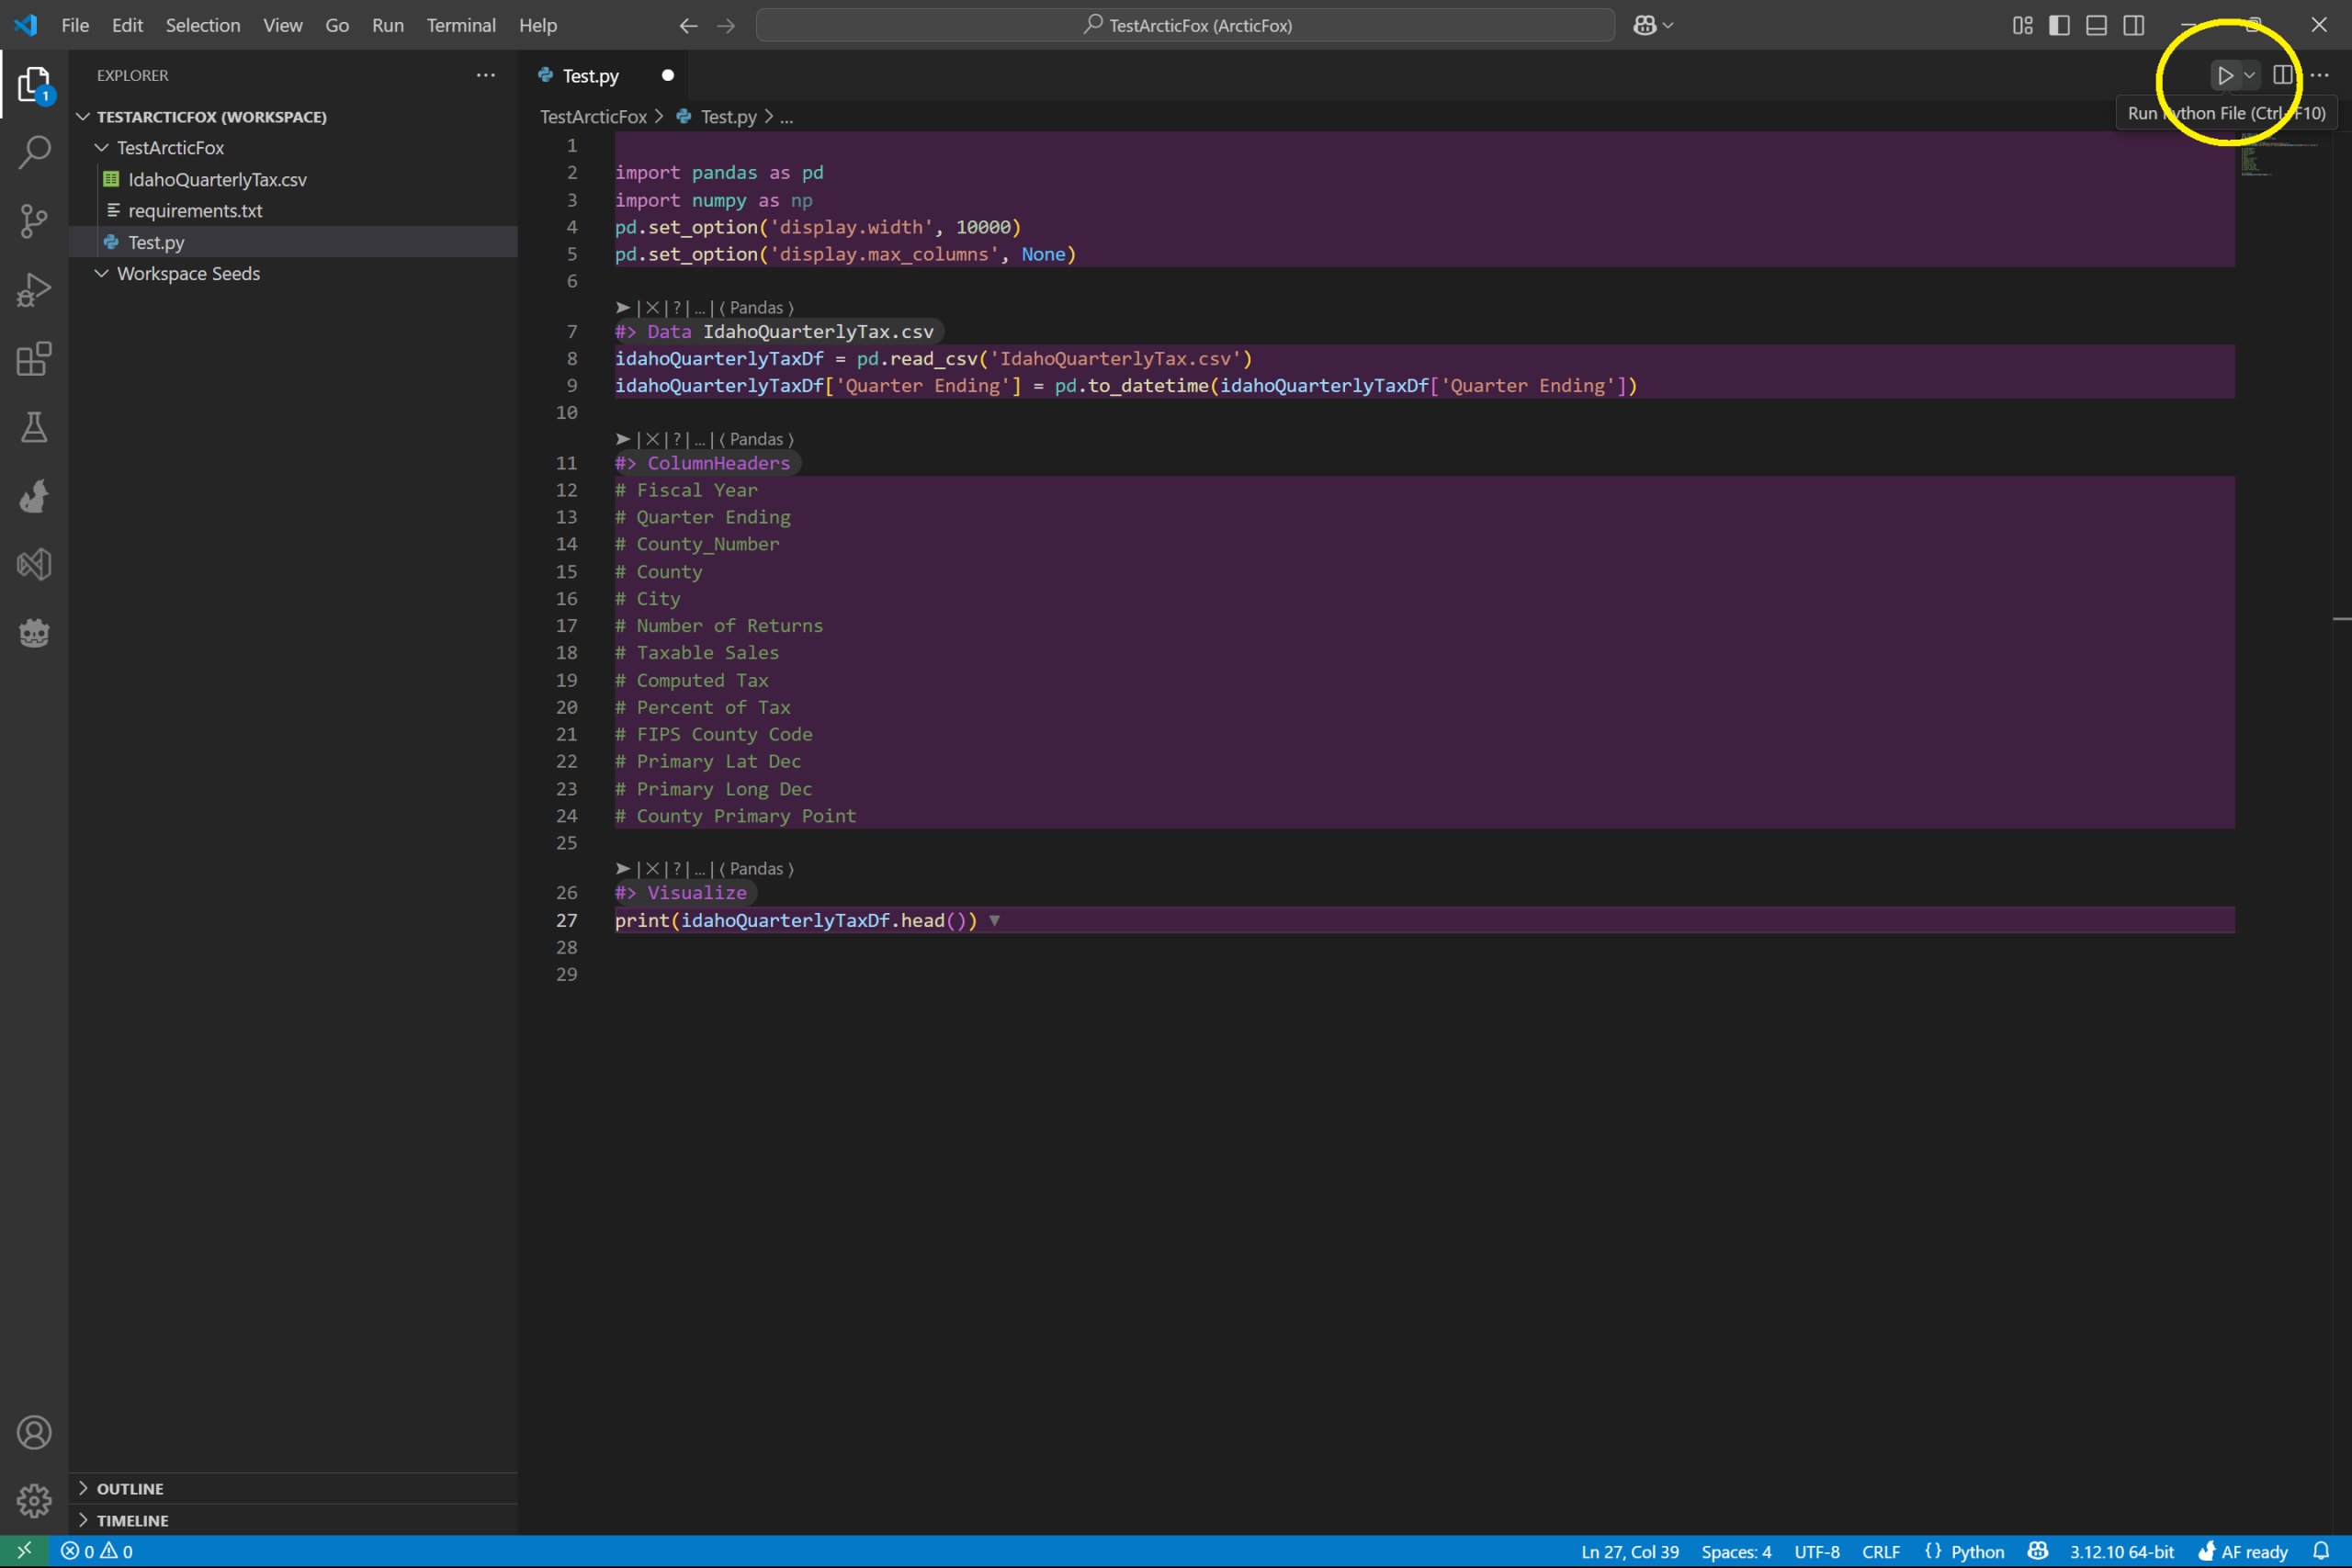
Arctic Fox will add the fetched code to print out and visualize the dataset. Visualize can be used to view the dataset as it is being processed to see how the processing evolves.
To see the data from the file, run the Python script. This can be done by pressing the arrow in the top right corner of VS Code.
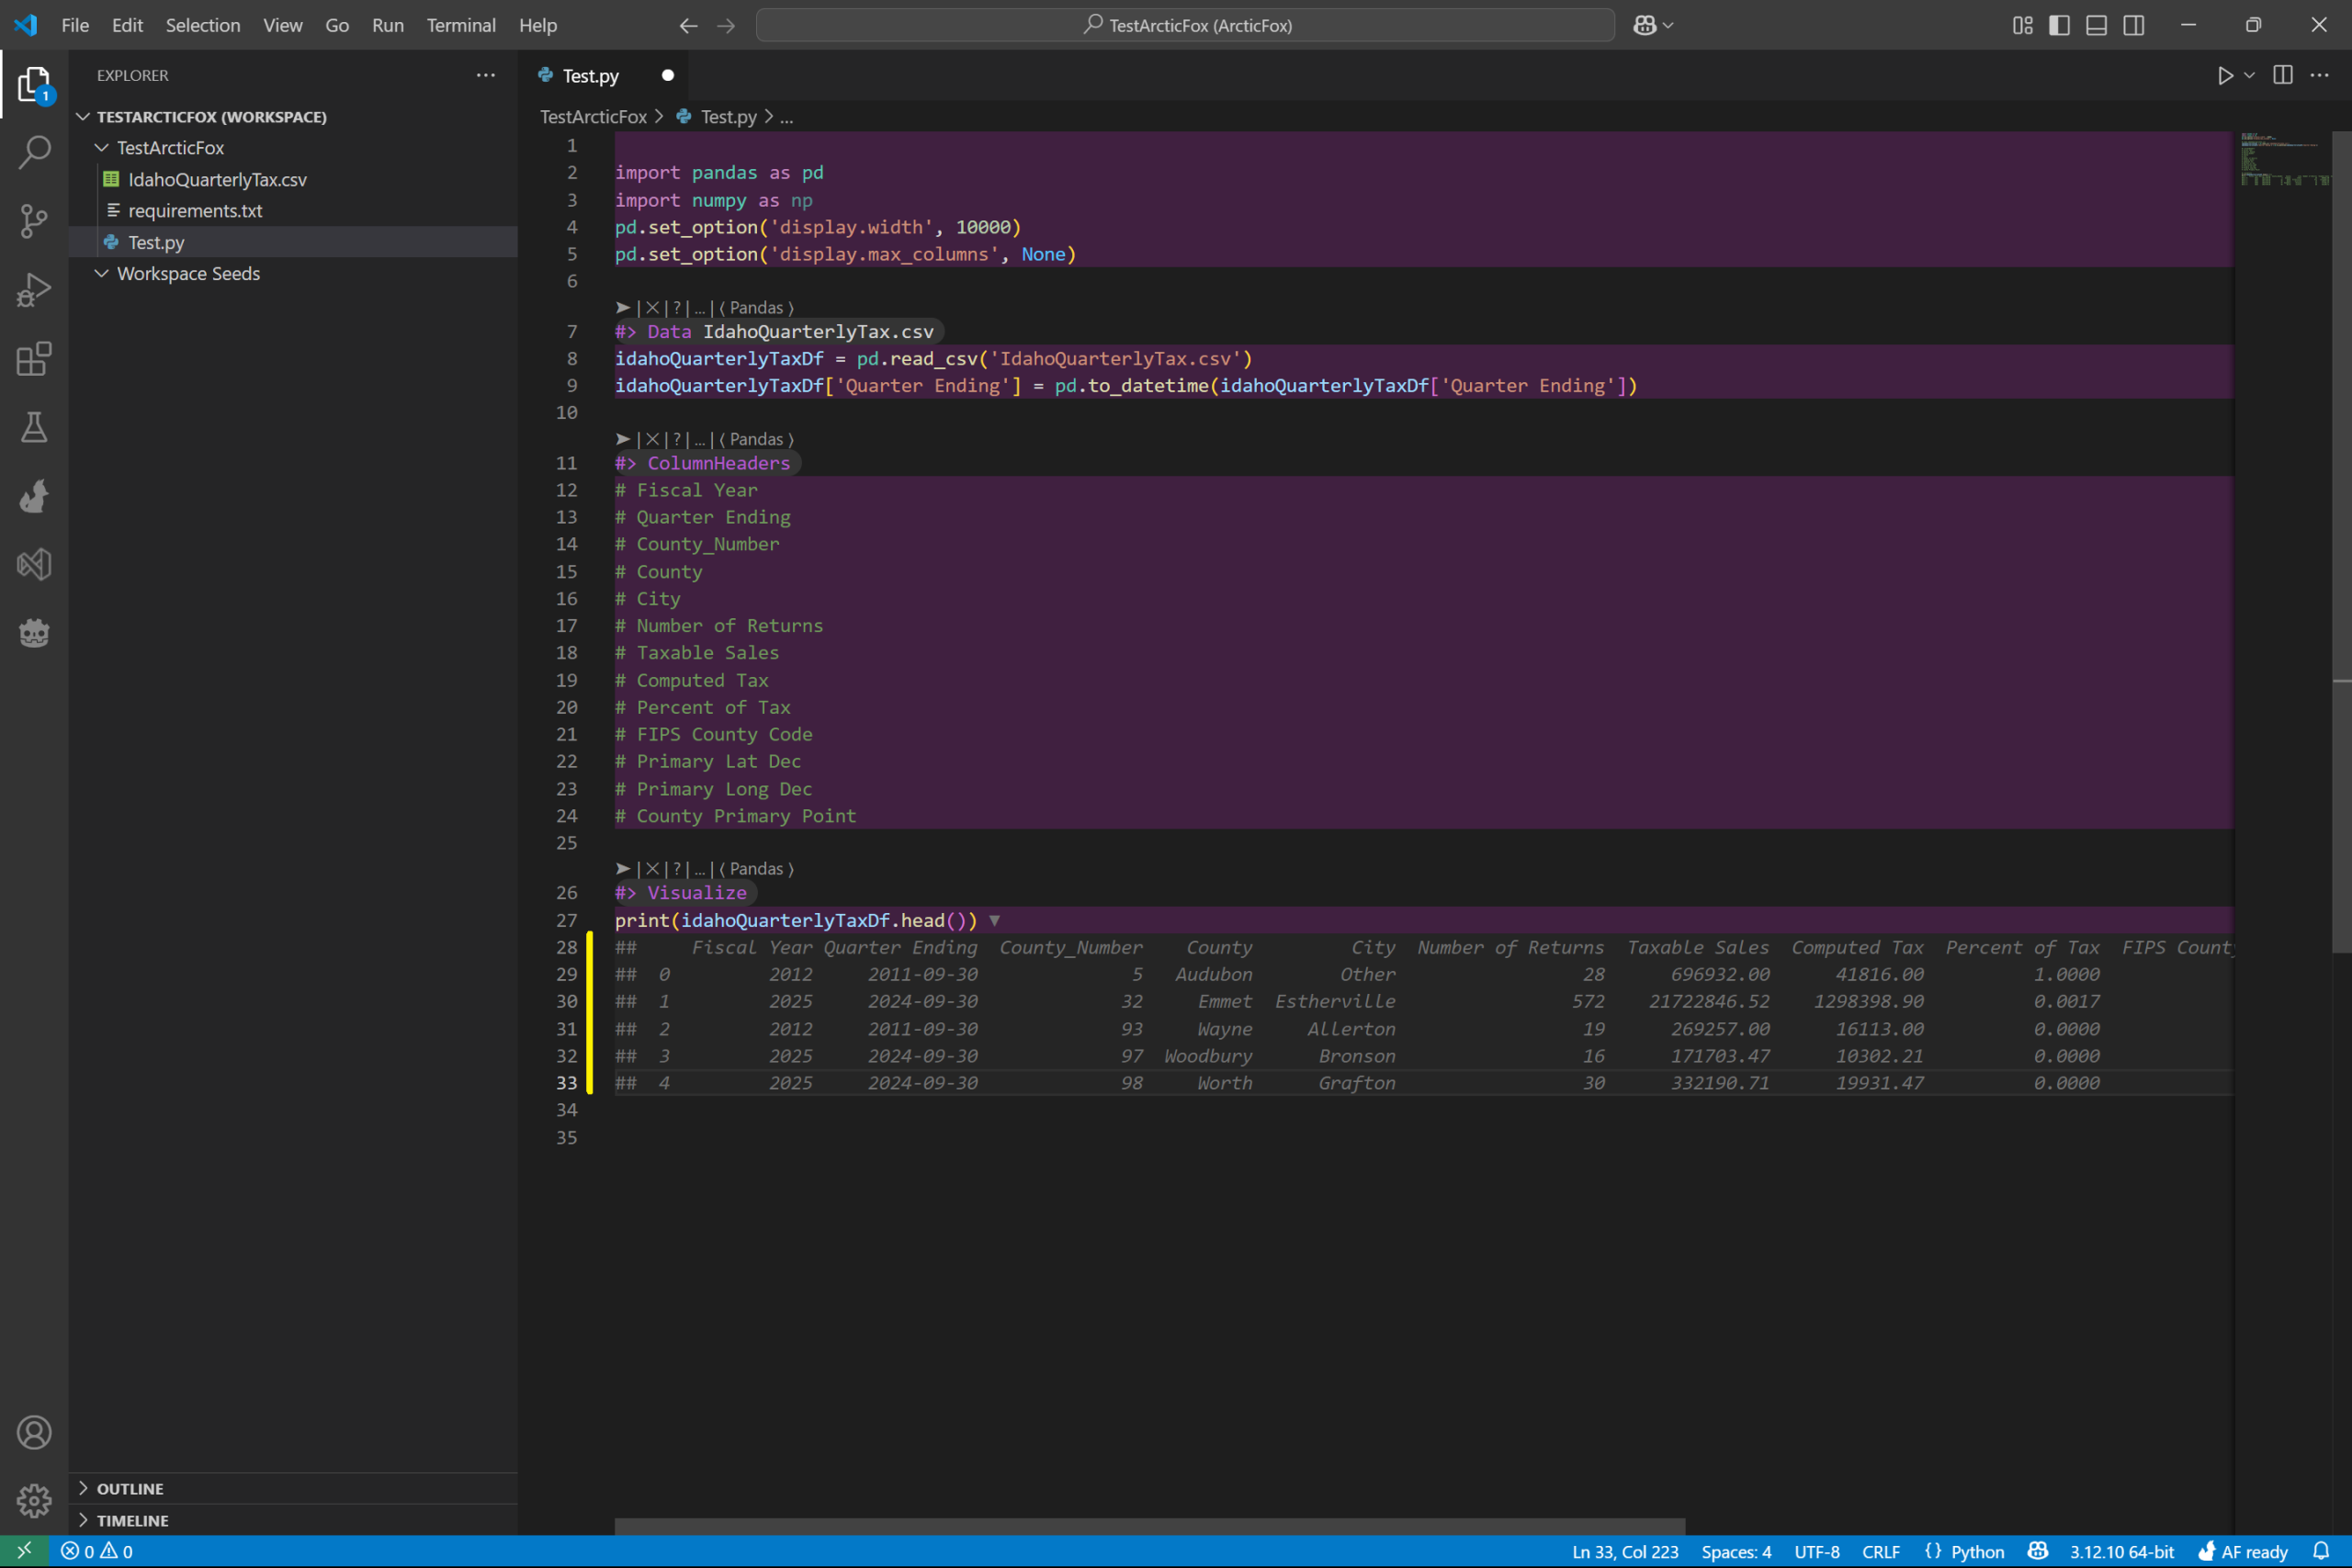
After the file runs, which will likely happen in a terminal, Arctic Fox will print the result of the Visualize print command within the file. From the data, we can easily see information pertaining to the year, date, county, city, and tax amounts collected.
Compute a Column Average with a Kit
Now, we will compute the average Taxable Sales for the dataset. Unlike the ColumnHeaders and Visualize kits, which did not need options, we will pass additional information into the ColumnAverage kit.
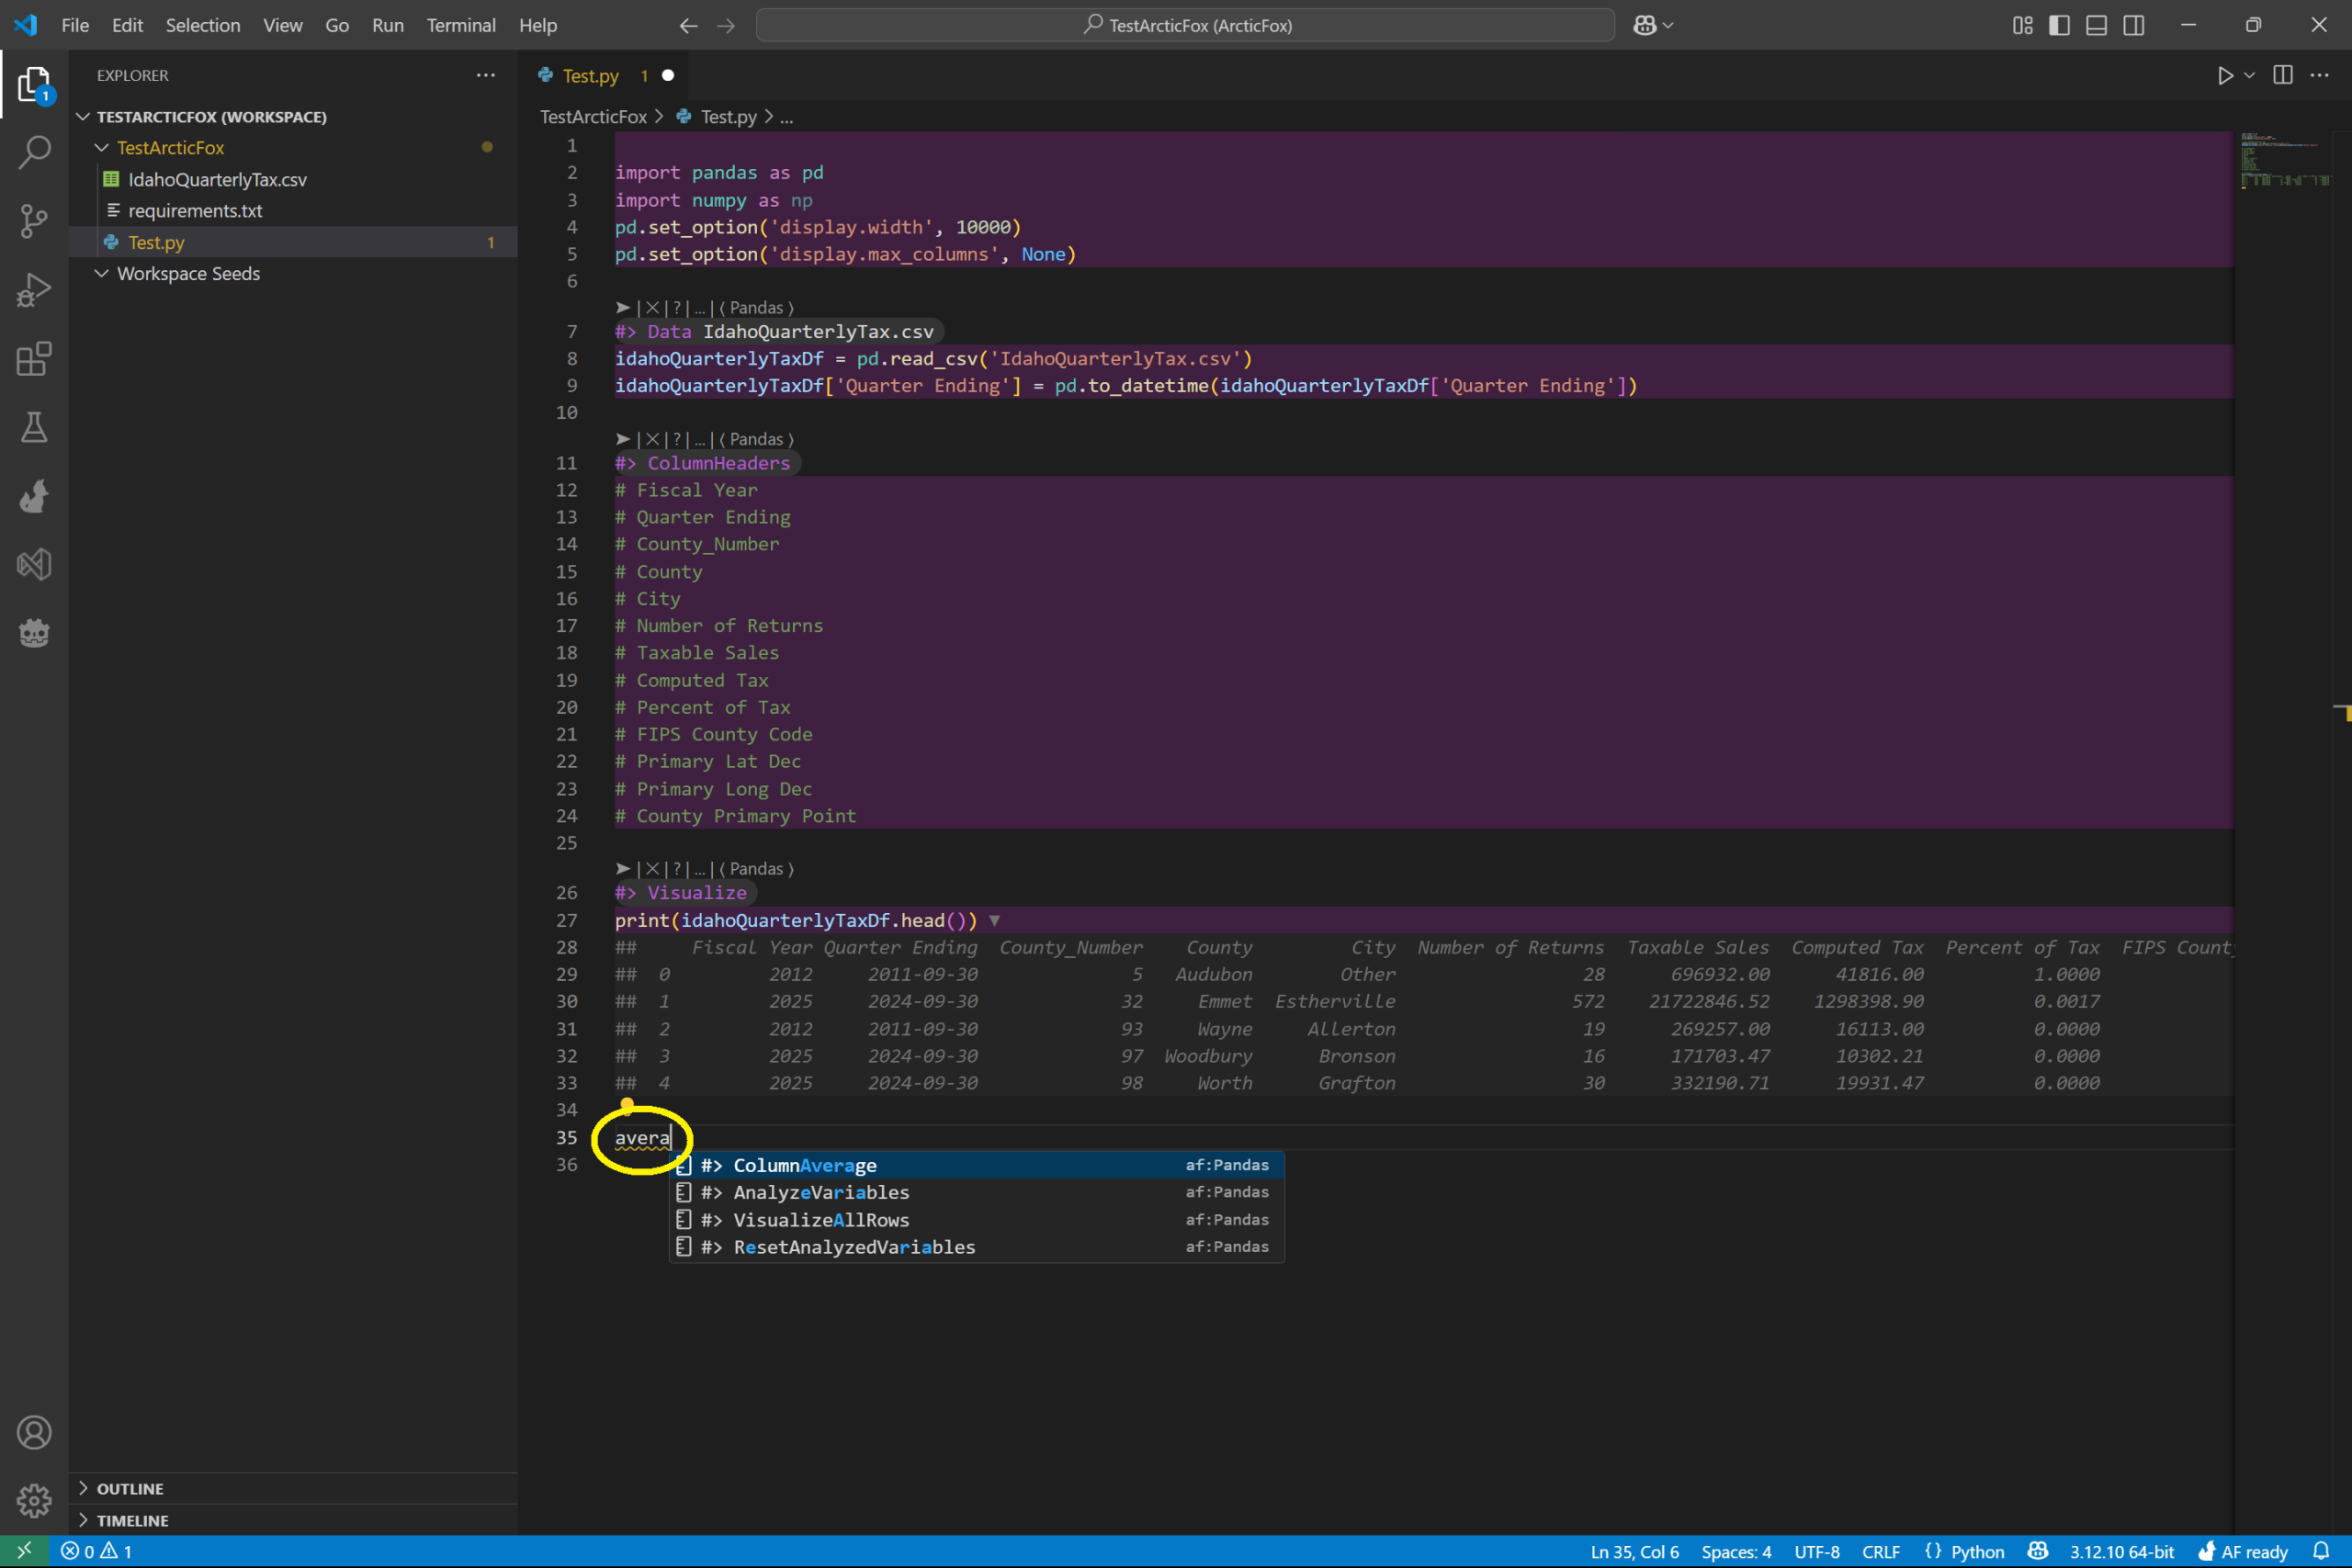
Following a similar process, after the table printout, start typing the word Average. Press enter when the autocomplete has ColumnAverage highlighted.
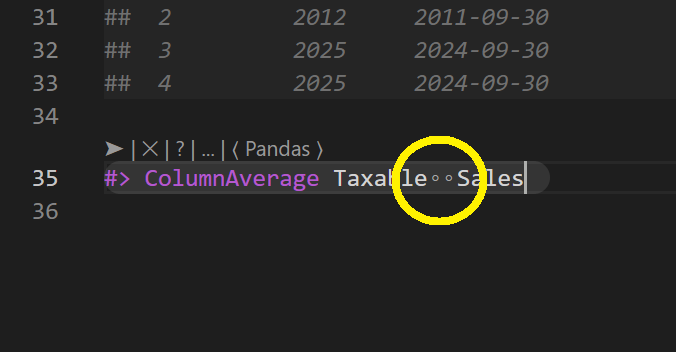
After ColumnAverage, on the same line, type the name of the column we want to get the average of. In this case, it is the Taxable Sales column.
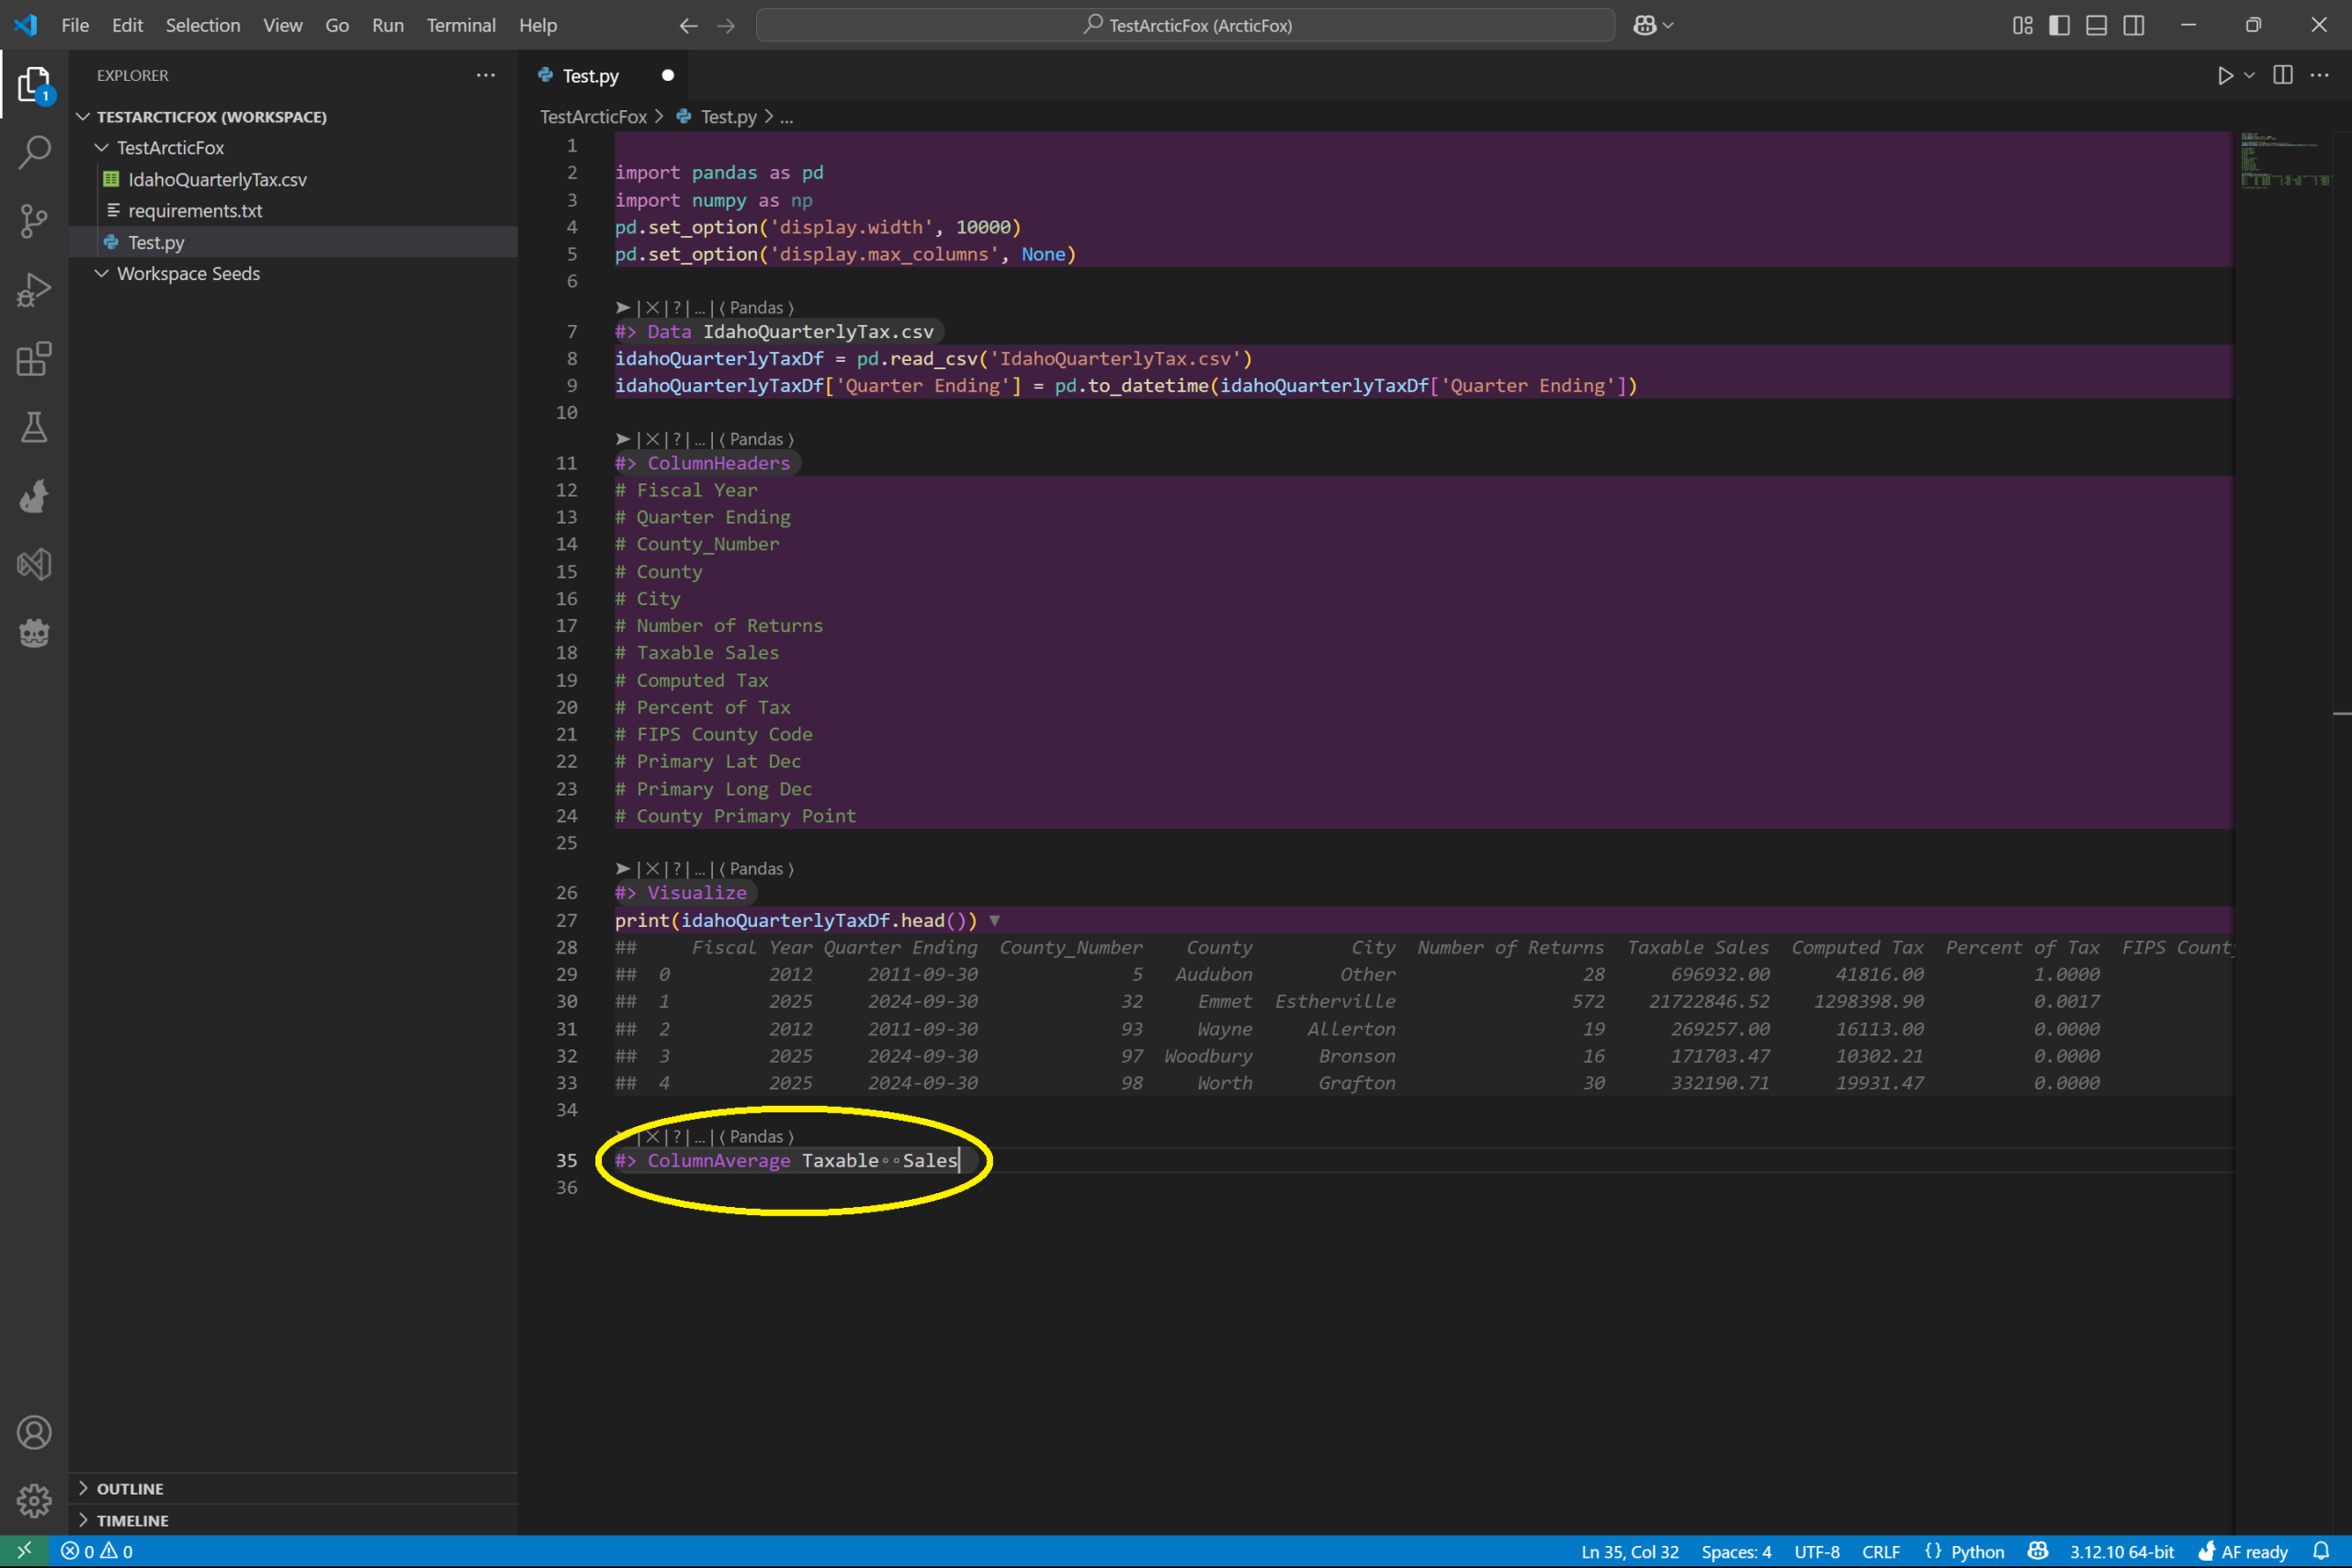
Note: that when you type Taxable Sales, you will need to put two space characters between Taxable and Sales. This is referred to as a connected space and you will see two bubbles identifying the space as connected.
This means that the space is to be used within the column name itself and is not separating multiple columns.
Then, on the same line, add –print. Almost every kit can accept the –print option and will print the result of the operation into the file for easy use.
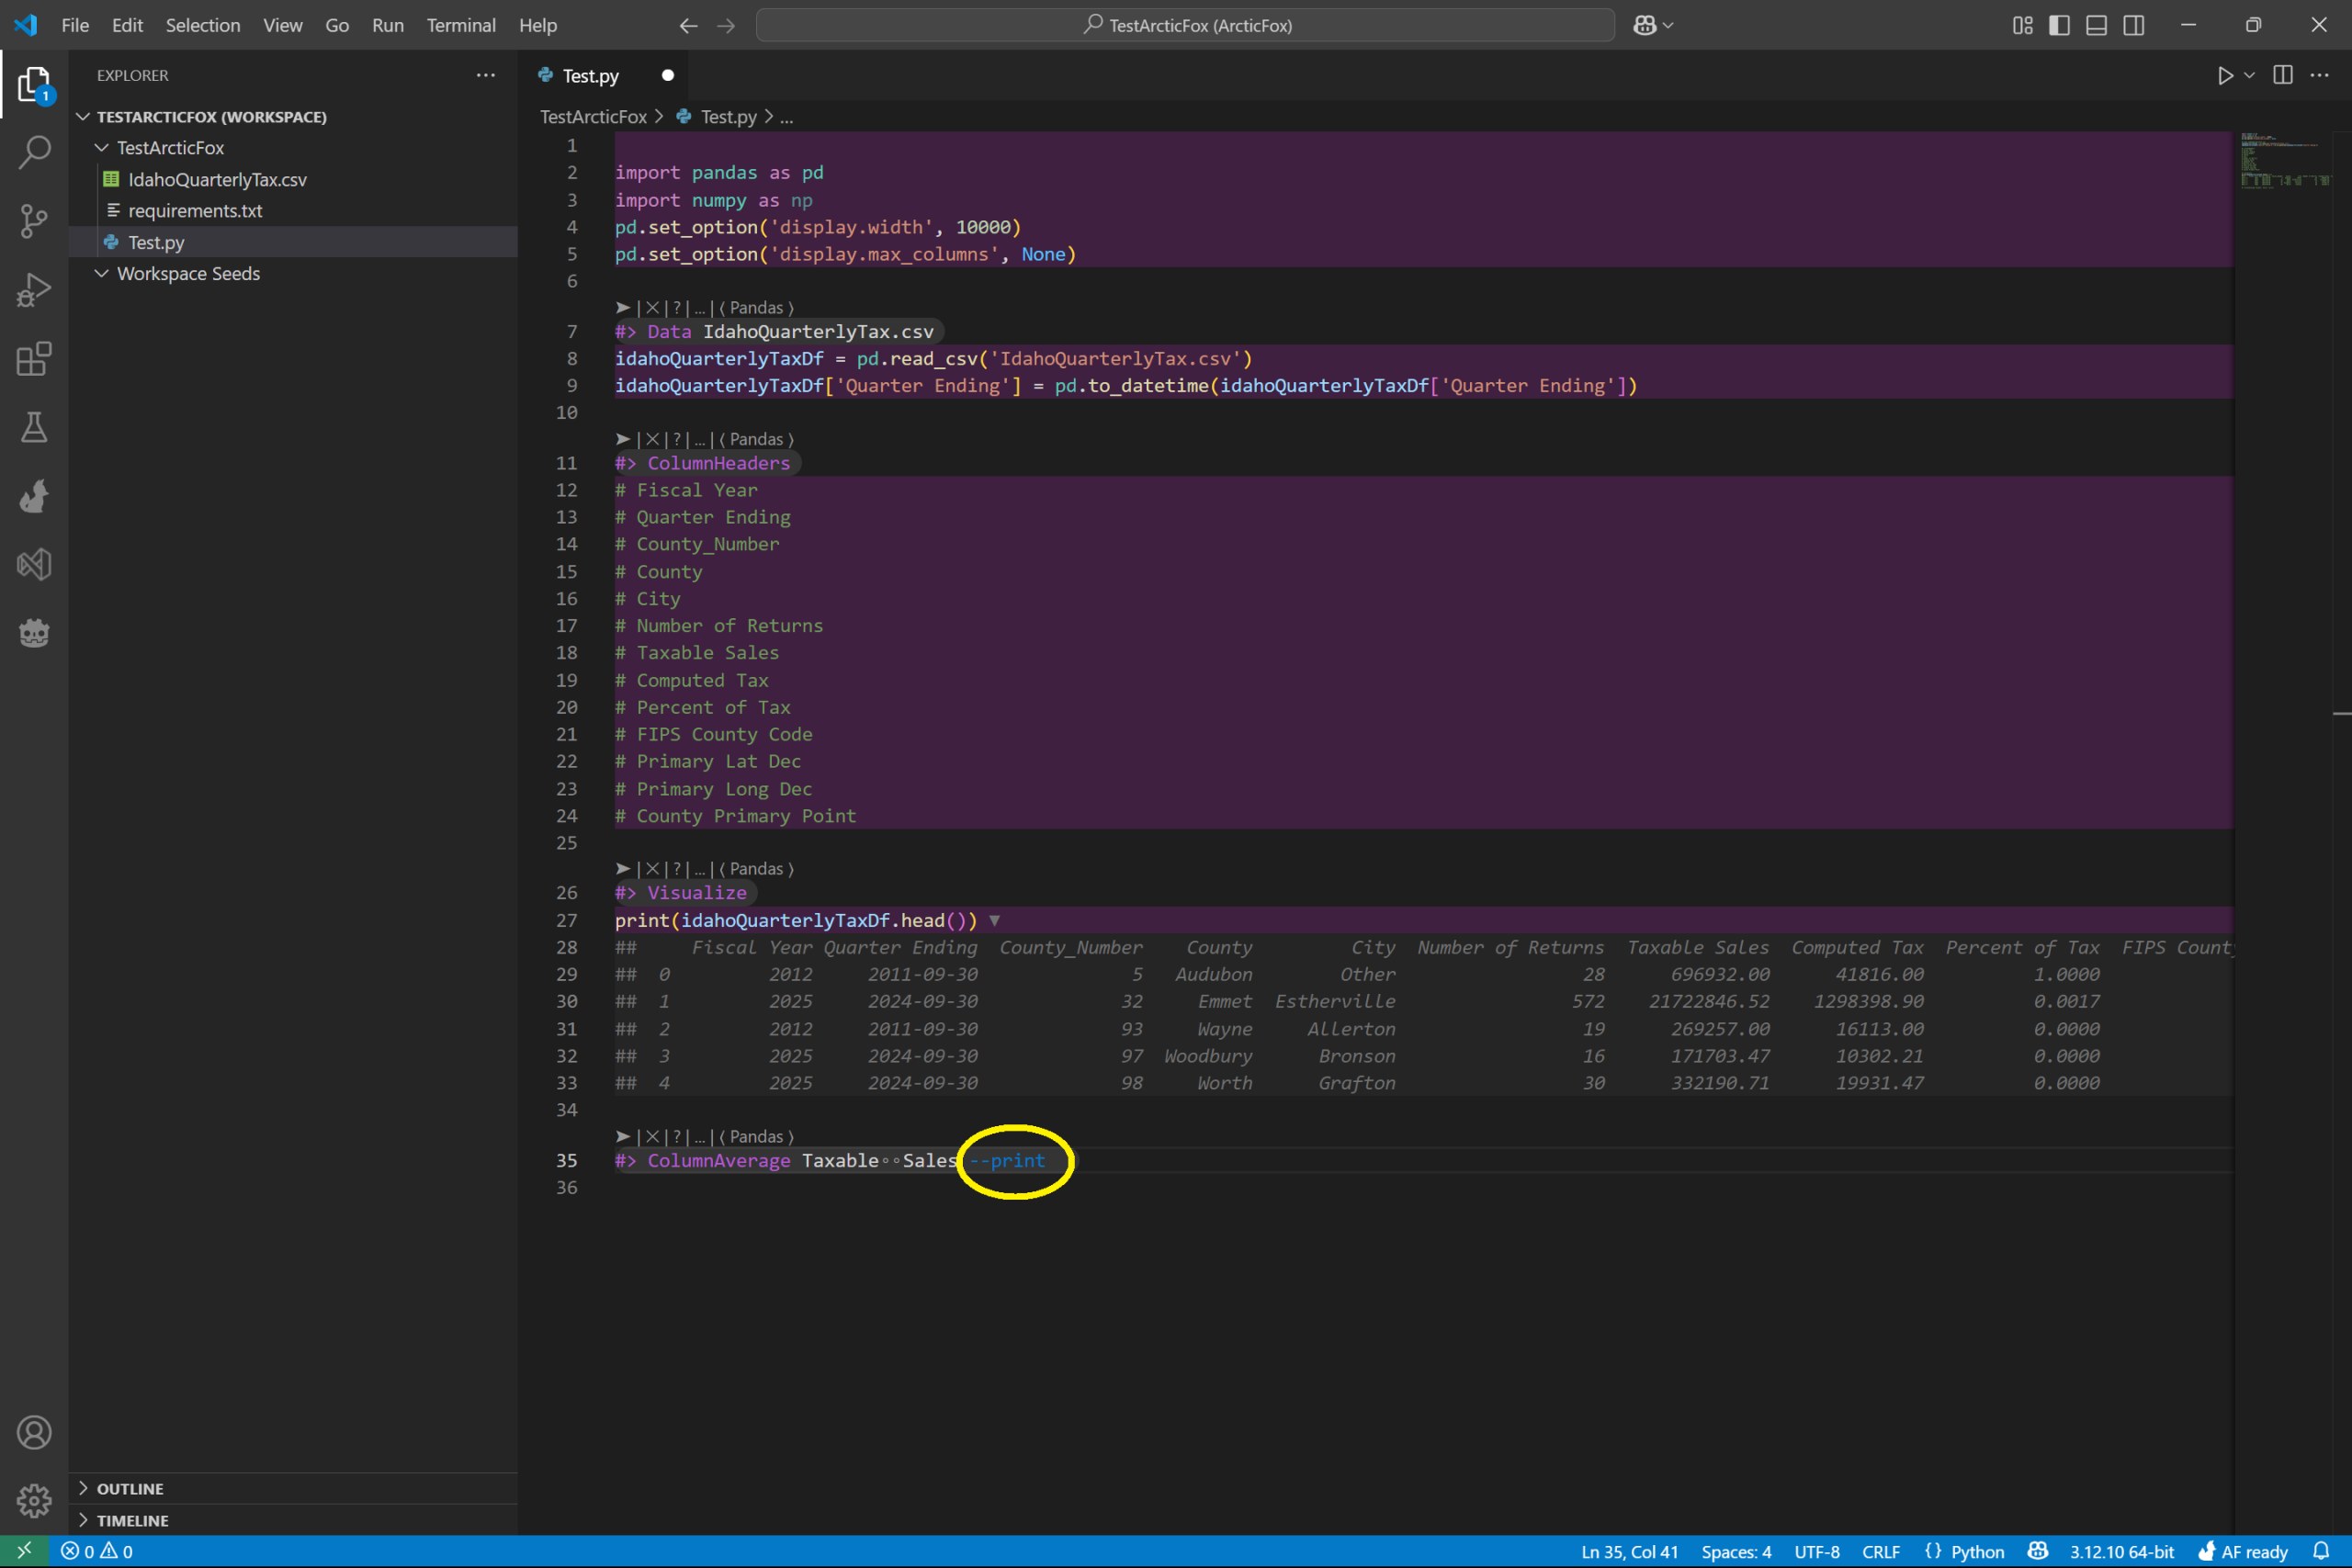
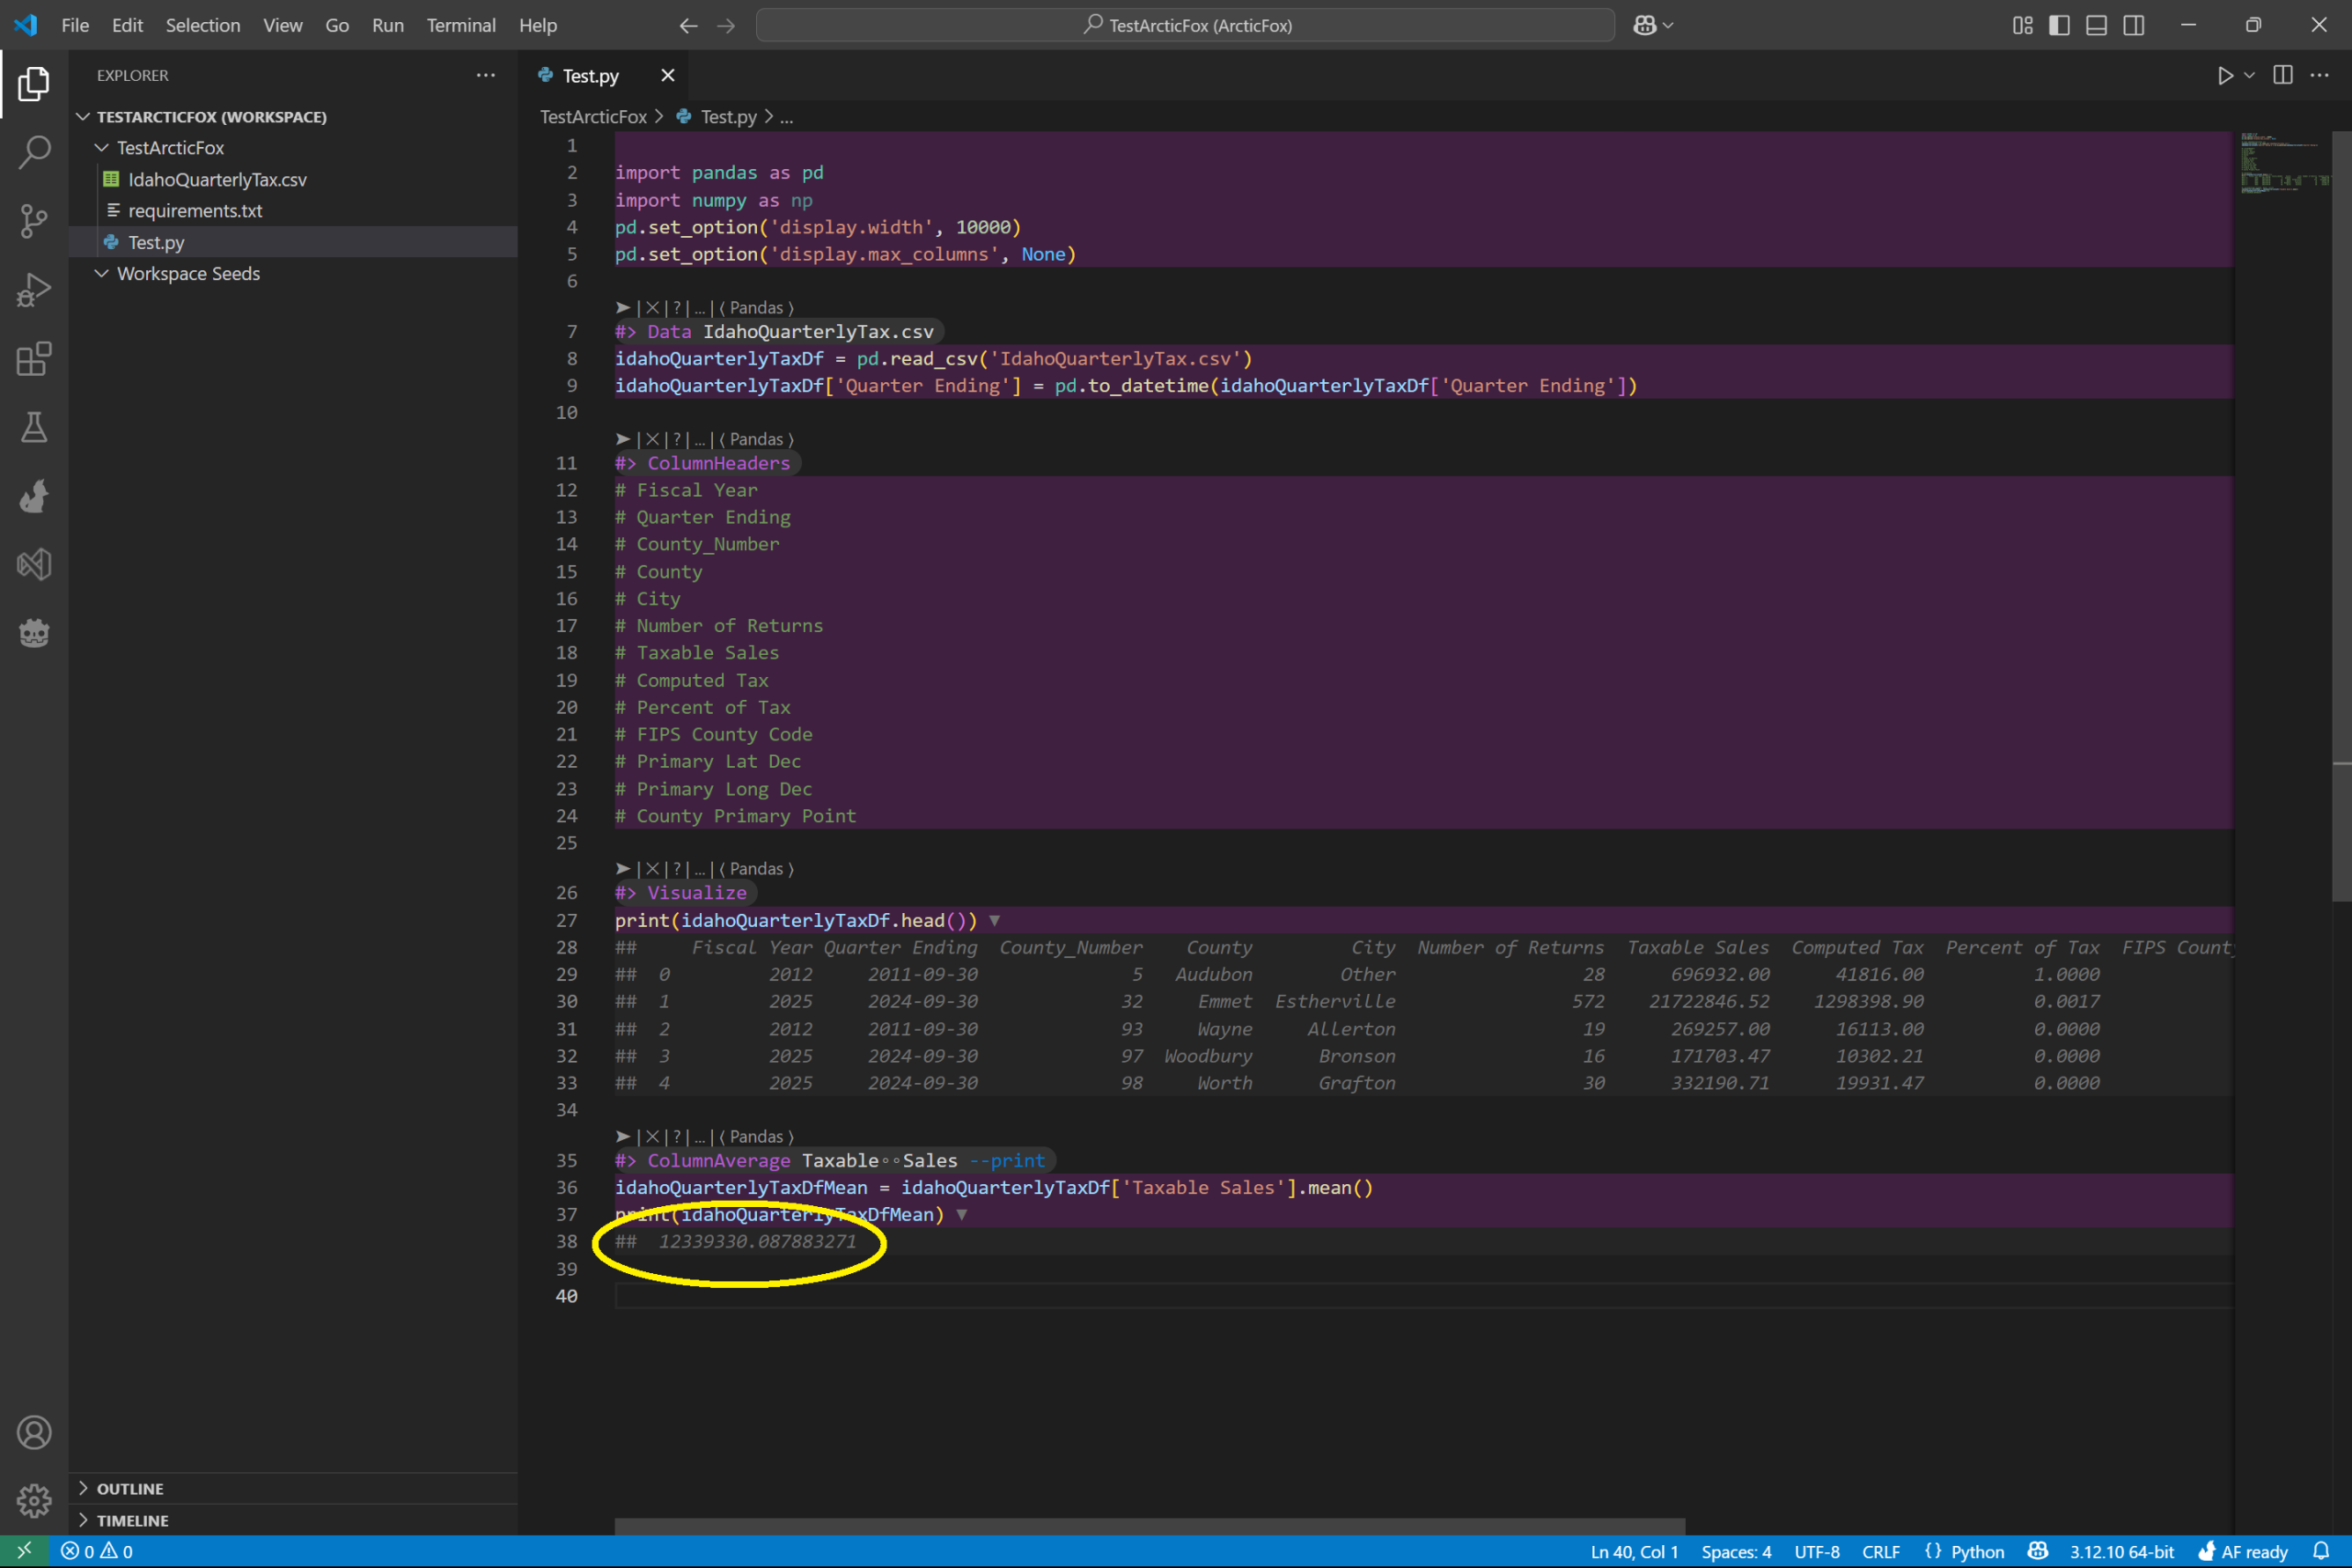
Let the kit fetch code by again pressing enter on the line or clicking the arrow above ColumnAverage.
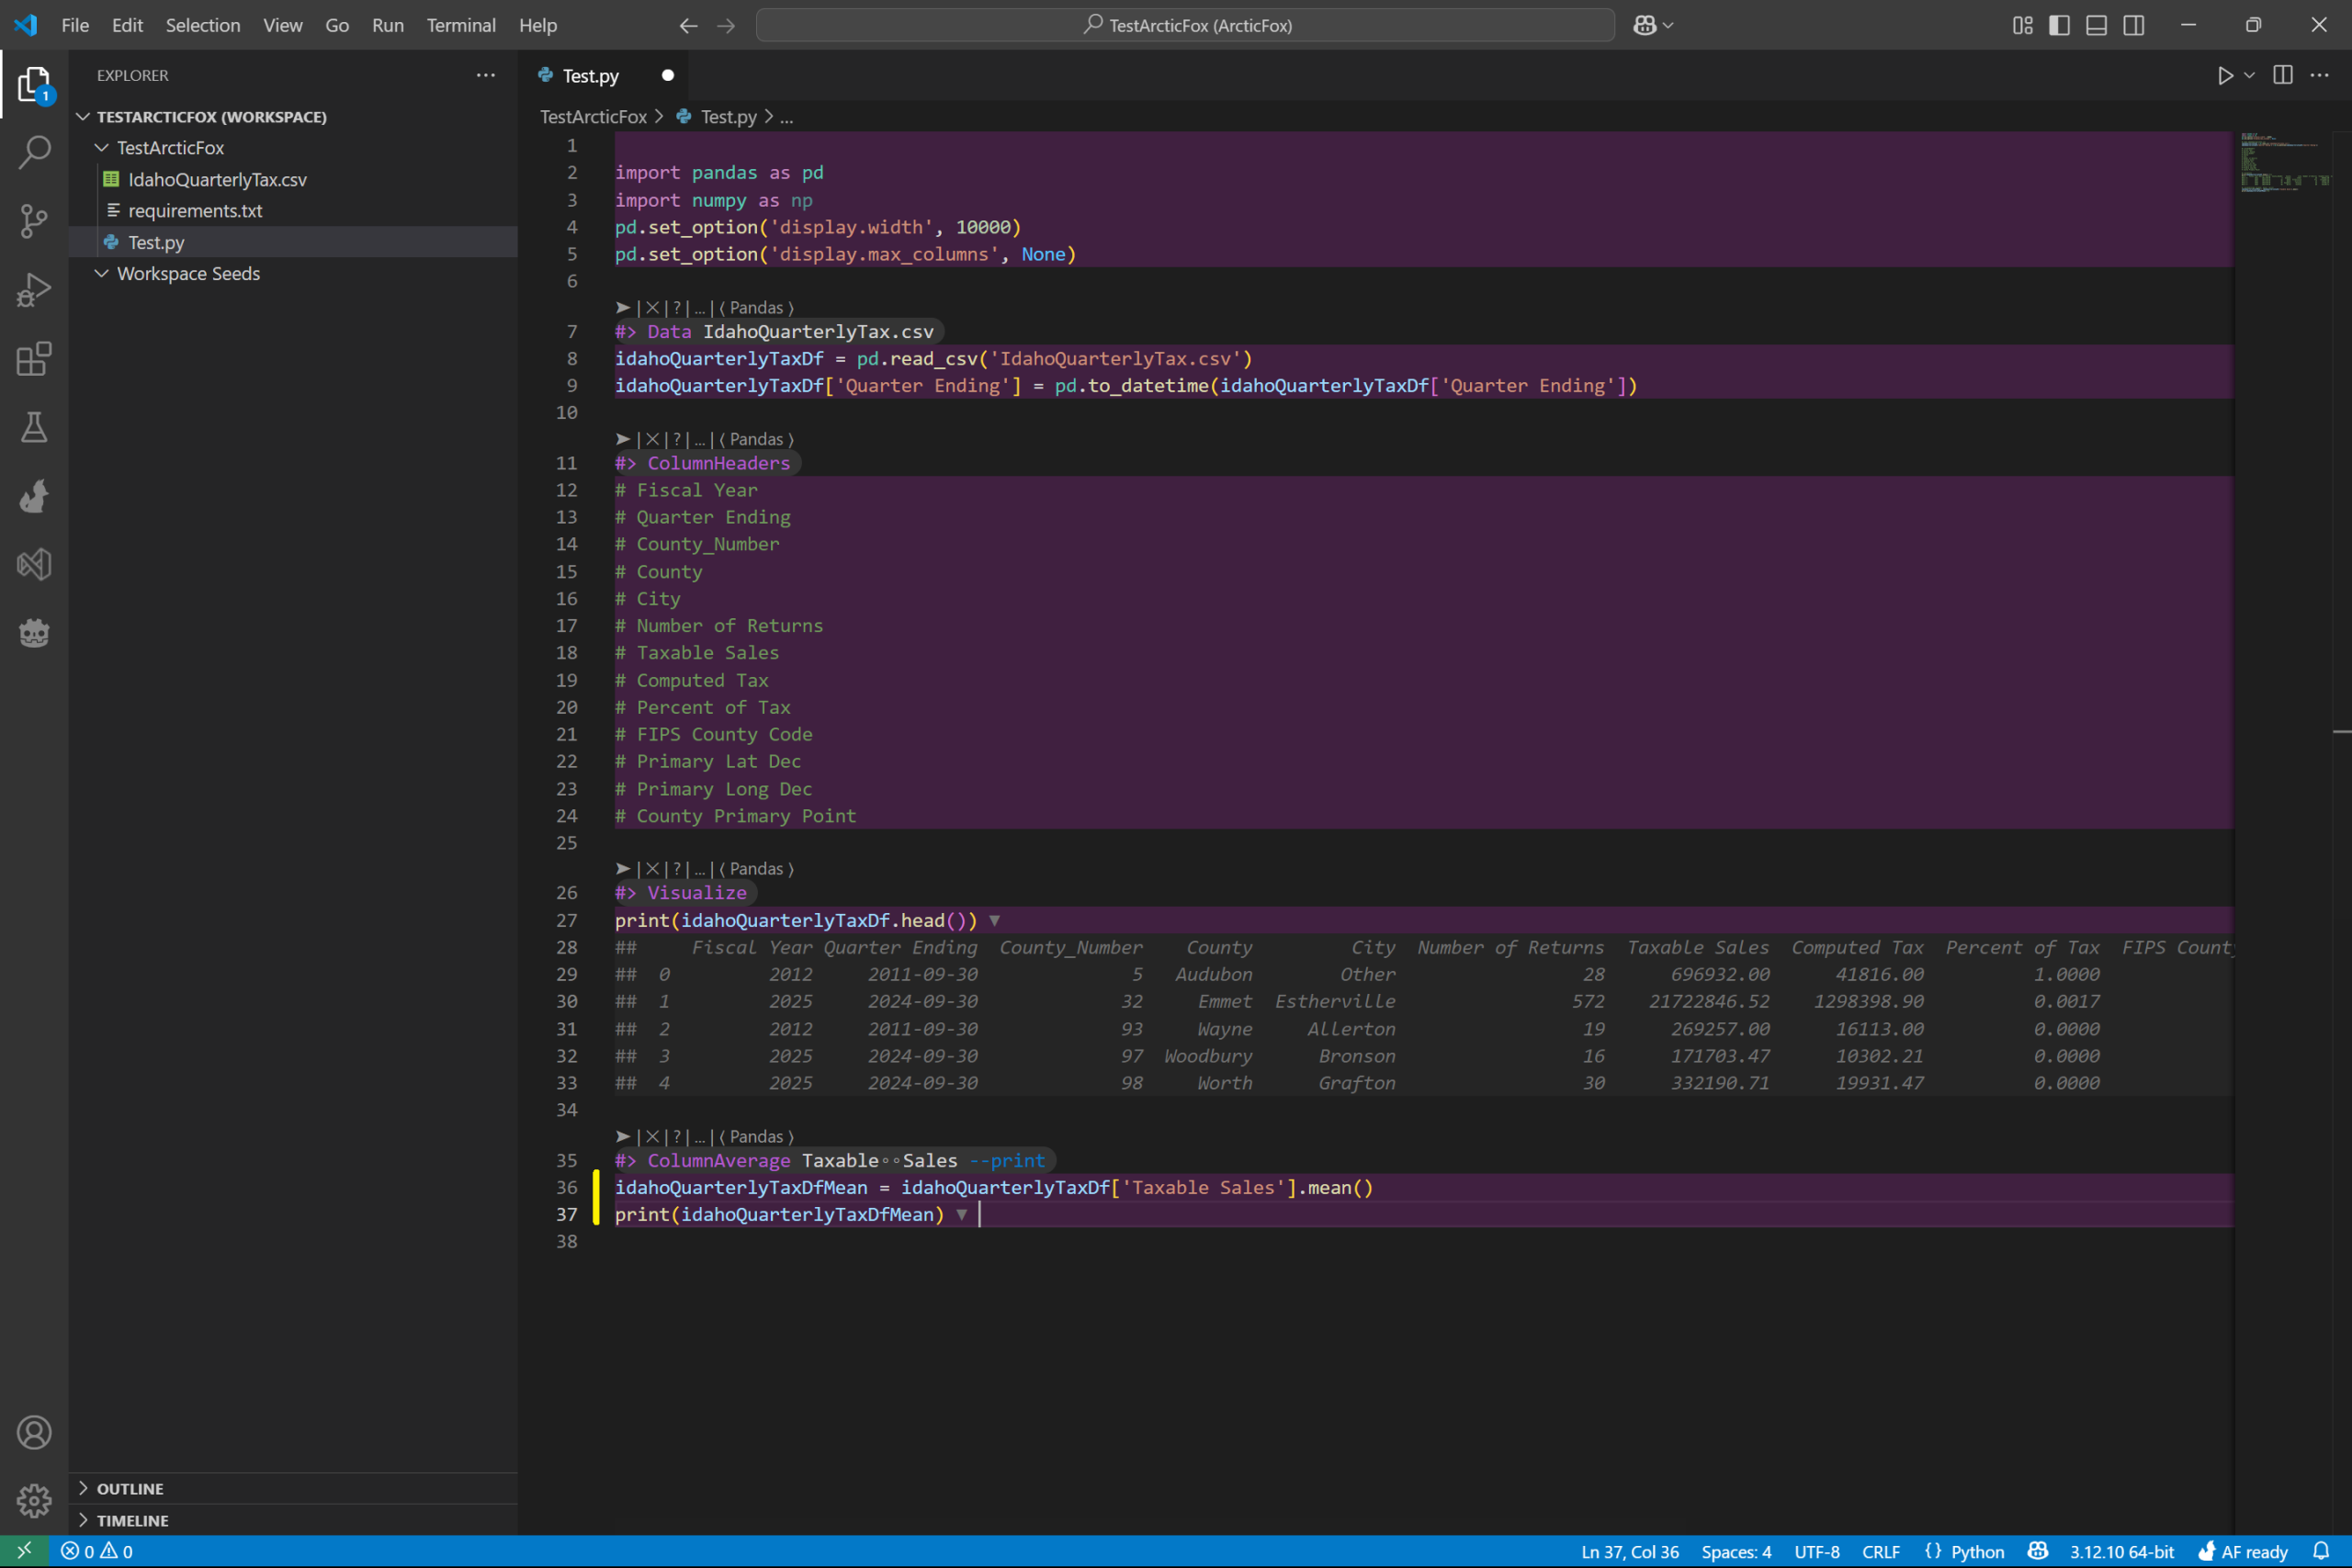
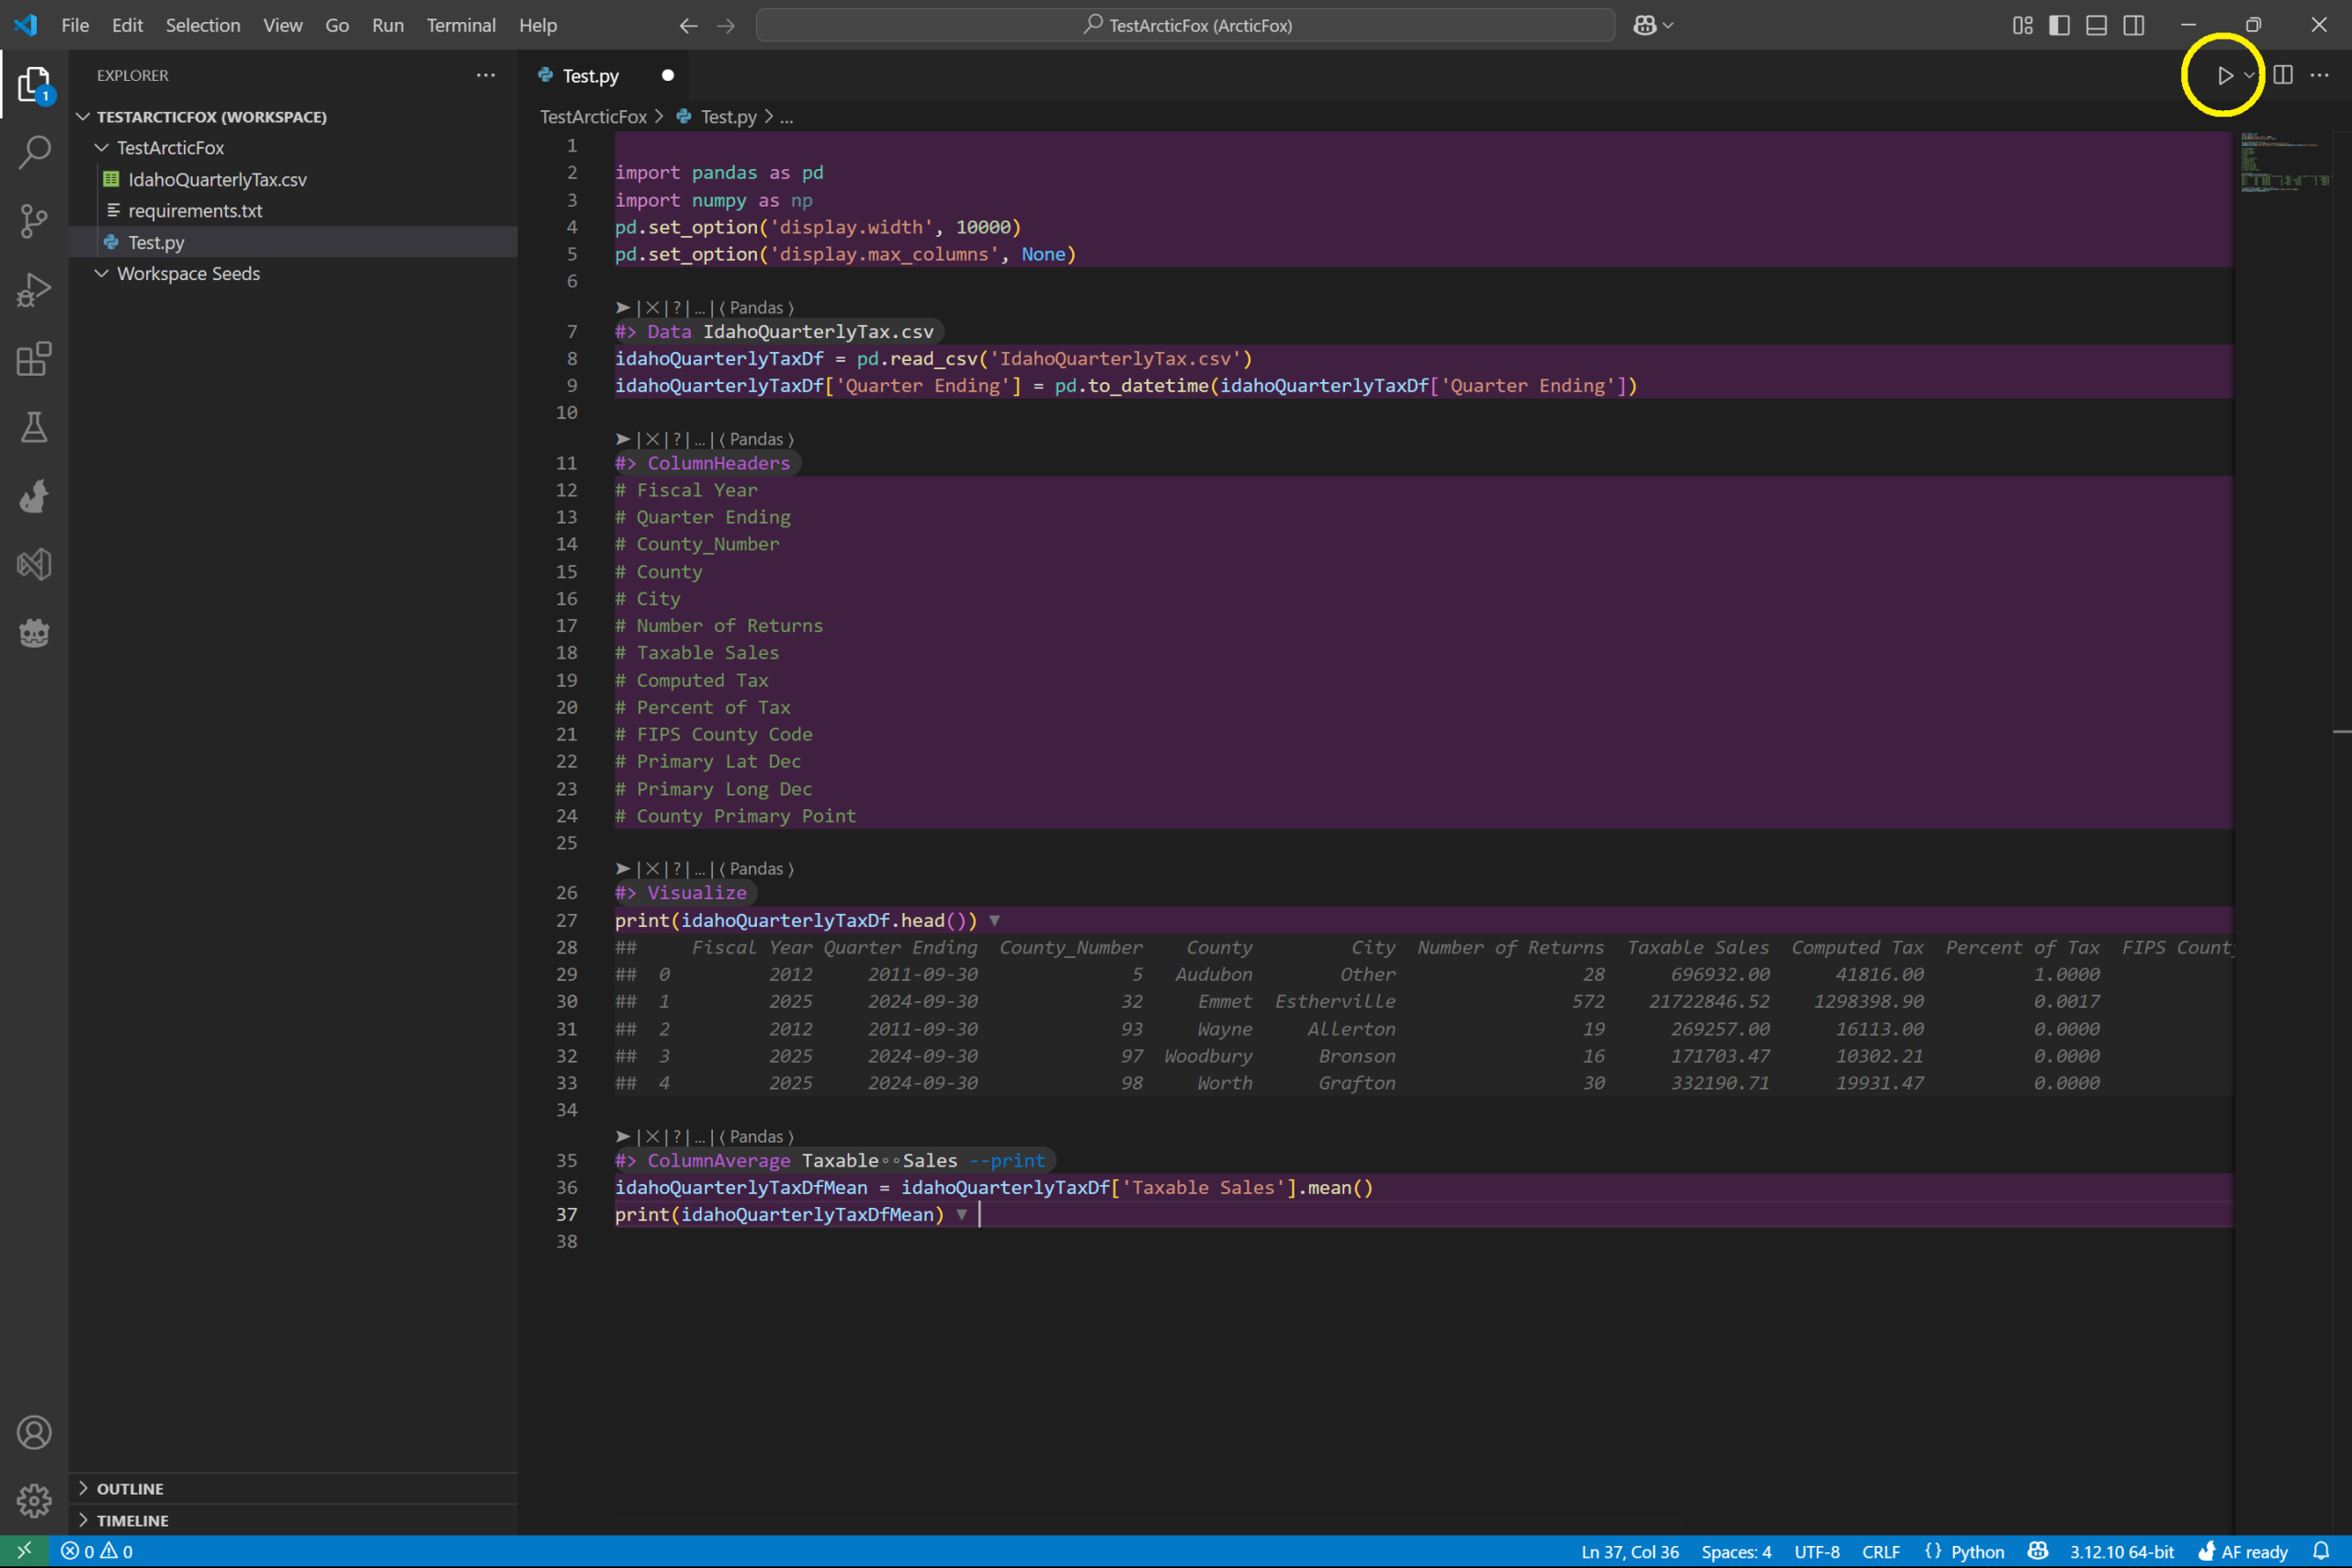
Run the Python script again by clicking the arrow in the top right of VS Code.
Once the script runs, you will see the wonderful average of 12339330.087883271 printed into the file! What an average!
Multiple Kits Completed
And there you have it! We used four kits together and computed the average taxable sales. Congrats! In this guide we:
– downloaded a publicly accessible dataset
– opened the dataset in a python script
– displayed the column headers
– visualized the data as a table
– computed the average of the taxable sales column
In the next guide, we will show you how to use the kit search and guides to make it easier to find and use Arctic Fox kits!